| Fire incidents reported |
|---|
| Sreet name | Count |
|---|
| HWY 45 S HWY | 20 | | HWY 45 SOUTH HWY | 16 | | BUCKATUNNA MTZION RD | 12 | | BUCKATUNNAMT ZION RD | 12 | | 45 HWY | 10 | | HWY 45 HWY | 10 | | BEASLEY GARDNER RD | 8 | | BUCKATUNNA MILLRY RD | 8 | | HILL DR | 8 | | HWY 45 SOUTH | 8 | | BUCKATUNNA MT ZION RD | 6 | | BUCKATUNNACHICORACLARA RD | 6 | | EAST ROBINSON JUNCTION RD | 6 | | HOPKINS RISEN RD | 6 | | JORDAN SUMRALL RD | 6 | | RED CREEK CHURCH RD | 6 | | WOULARD BEND RIVER ROAD RD | 6 | | 16 JOE TAYLOR ROAD | 4 | | 45 EUGENE WORSHAM DRIVE | 4 | | 570 BUCKATUNNA MILLRY RD RD | 4 | | BCC RD | 4 | | BUCKATUNNA MT ZION RD RD | 4 | | CARSON RD | 4 | | CHASON ERET RD | 4 | | CHASON ERET ROAD | 4 |
| | | Fire incidents reported |
|---|
| Sreet name | Count |
|---|
| CHICORA GREENE COUNTY RD | 4 | | CHICORA RIVER RD | 4 | | DENHAM PROGRESS RD | 4 | | HARDTIMES ROAD | 4 | | HAYES RD | 4 | | HIGHWAY 45 SOUTH HWY | 4 | | HWY 45 S | 4 | | JOE TAYLOR ROAD | 4 | | LACY RD | 4 | | TAYLOR CIRCLE | 4 | | VERNON RIGNEY RD | 4 | | WOULARD BEND RD | 4 | | 1014 BUCKATUNNA CHICORA CLARA RD | 2 | | 106 JR MERRIL RD RD | 2 | | 110 CARSON RD RD | 2 | | 1112 HWY 45 SOUTH | 2 | | 113 JR MERRILL RD RD | 2 | | 113 JR MERRILL ROAD | 2 | | 1209 BUCKATUNNA MT ZION ROAD | 2 | | 1248 HWY 45 S HWY | 2 | | 125 JR MERRILL OLD HWY 45 RD RD | 2 | | 1287 BUCKATUNNA MT ZION RD RD | 2 | | 13 HILL DR DR | 2 | | 15 RAMSEY ROAD | 2 | | 153 POWE SIBLEY RD RD | 2 |
|
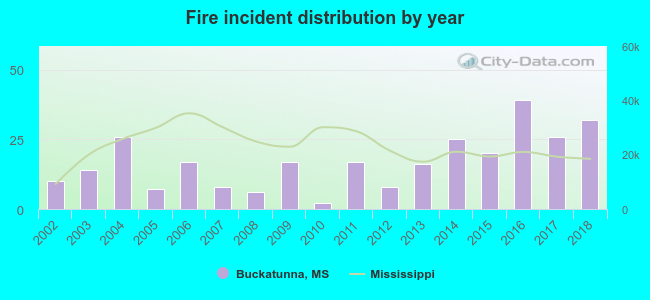 Based on the data from the years 2002 - 2018 the average number of fires per year is 17. The highest number of reported fires - 39 took place in 2016, and the least - 2 in 2010. The data has a rising trend.
 27.6% incidents where reported in the morning and 72.4% in the evening. The most fires (16.9%) took place on Saturday, and the least (12.8%) on Tuesday.
 Based on the 290 fire incident reports from years 2002 - 2018 most fires (15.9%) took place during March, and the least (4.8%) in May.
 Out of all 442 cases reported during the years 2002 - 2018, the most belonged to the categories: Fire (65.6%), Rescue & EMS (20.6%), and Hazardous Condition (5.7%).
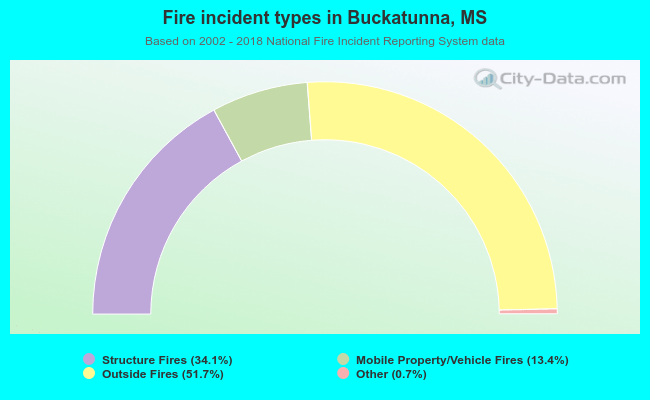 When looking into fire subcategories, the most reports belonged to: Outside Fires (51.7%), and Structure Fires (34.1%).