Brusly: Fire Incidents, Louisiana (LA)
Where are fire incidents reported in Brusly, LA
Something went wrong! Please refresh the page.
|
| |||||||||||||||||||||||||||||||||||||||||||||||||||||||||||||||||||||||||||||||||||||||||||||||||||||||||||||
2005 - 2018 National Fire Incident Reporting System (NFIRS) incidents
- Incident types reported to NFIRS in Brusly, LA
- 85662.7%Rescue & EMS
- 19314.1%Fire
- 1128.2%Hazardous Condition
- 886.4%Good Intent Call
- 795.8%False Alarm
- 312.3%Service Call
- 30.2%Special Incident
- 20.1%Severe Weather
- Fire incident types reported to NFIRS in Brusly, LA
- 9046.6%Outside Fires
- 5930.6%Structure Fires
- 3417.6%Mobile Property/Vehicle Fires
- 105.2%Other
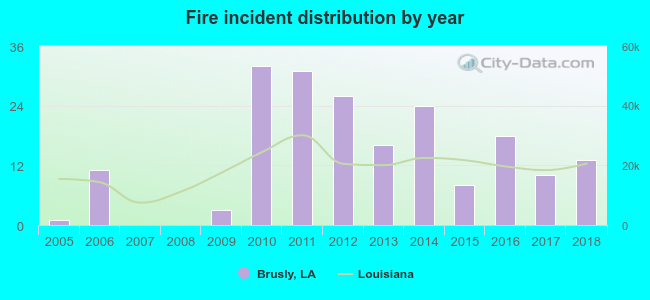 According to the data from the years 2005 - 2018 the average number of fire incidents per year is 14. The highest number of fire incidents - 32 took place in 2010, and the least - 0 in 2007. The data has a growing trend.
 34.7% incidents where reported in the morning and 65.3% in the evening. The most fires (17.6%) took place on Saturday, and the least (9.8%) on Friday.
 Based on the 193 fire incidents from years 2005 - 2018 most fires (13.0%) took place during March, and the least (5.2%) in August.
 Out of all 1,365 cases reported during the years 2005 - 2018, the most belonged to the categories: Rescue & EMS (62.7%), Fire (14.1%), and Hazardous Condition (8.2%).
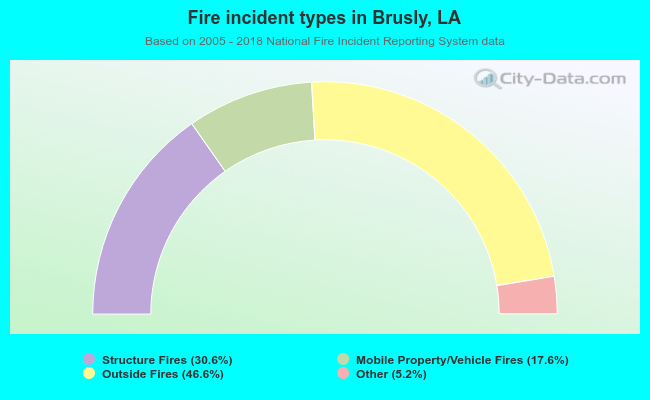 When looking into fire subcategories, the most reports belonged to: Outside Fires (46.6%), and Structure Fires (30.6%).