Brownville: Fire Incidents, New York (NY)
Where are fire incidents reported in Brownville, NY
Something went wrong! Please refresh the page.
|
| |||||||||||||||||||||||||||||||||||||||||||||||||||||||||||||||||||||||||||||||||||||||||||||||||||||||||||||
2002 - 2018 National Fire Incident Reporting System (NFIRS) incidents
- Incident types reported to NFIRS in Brownville, NY
- 41948.1%Rescue & EMS
- 14416.5%Hazardous Condition
- 13215.1%Fire
- 596.8%Good Intent Call
- 596.8%False Alarm
- 475.4%Service Call
- 60.7%Severe Weather
- 30.3%Overpressure Rupture
- 30.3%Special Incident
- Fire incident types reported to NFIRS in Brownville, NY
- 6650.0%Structure Fires
- 4634.8%Outside Fires
- 1511.4%Mobile Property/Vehicle Fires
- 53.8%Other
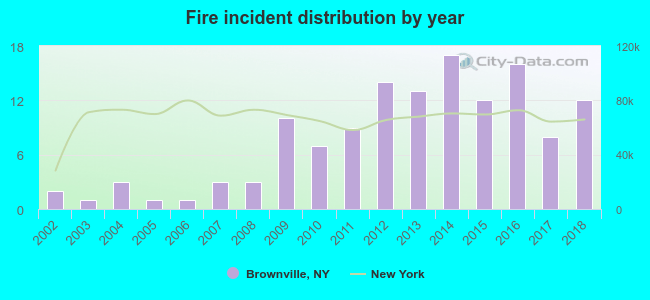 Based on the data from the years 2002 - 2018 the average number of fires per year is 8. The highest number of reported fires - 17 took place in 2014, and the least - 1 in 2003. The data has a growing trend.
 28.8% incidents where reported in the morning and 71.2% in the evening. The most fires (22.0%) took place on Sunday, and the least (6.1%) on Wednesday.
 According to the 132 fire incidents from years 2002 - 2018 most fires (18.2%) took place during April, and the least (0.8%) in October.
 Out of all 872 cases reported during the years 2002 - 2018, the most belonged to the categories: Rescue & EMS (48.1%), Hazardous Condition (16.5%), and Fire (15.1%).
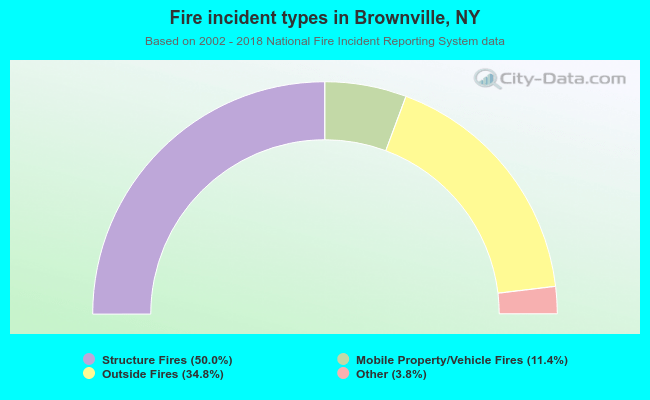 When looking into fire subcategories, the most reports belonged to: Structure Fires (50.0%), and Outside Fires (34.8%).