Brownsville: Fire Incidents, Texas (TX)
Where are fire incidents reported in Brownsville, TX
Something went wrong! Please refresh the page.
| Fire incidents reported | |
|---|---|
| Sreet name | Count |
| BOCA CHICA BLVD | 438 |
| PAREDES LINE RD | 262 |
| US HWY 77 NB FR | 256 |
| FM 511 | 238 |
| 14TH ST | 210 |
| MILITARY HWY | 198 |
| RUBEN M TORRES BLVD | 194 |
| US HWY 77 SB FR | 184 |
| ALTON GLOOR BLVD | 168 |
| PALM BLVD | 148 |
| OLD PORT ISABEL RD | 144 |
| ELIZABETH ST | 140 |
| CENTRAL BLVD | 132 |
| SOUTHMOST BLVD | 124 |
| MINNESOTA AVE | 122 |
| PADRE ISLAND HWY | 116 |
| SOUTHMOST RD | 116 |
| CENTRAL AVE | 114 |
| PRICE RD | 112 |
| 13TH ST | 106 |
| WASHINGTON ST | 90 |
| MORNINGSIDE RD | 88 |
| CALLE MILPA VERDE | 86 |
| FM | 84 |
| FM 802 | 84 |
| INTERNATIONAL BLVD | 84 |
| COFFEEPORT RD | 76 |
| INDIANA AVE | 76 |
| 77/83 EXPY | 74 |
| MEXICO BLVD | 72 |
| Other | 2,779 |
2004 - 2018 National Fire Incident Reporting System (NFIRS) incidents
- Incident types reported to NFIRS in Brownsville, TX
- 16,08840.7%Rescue & EMS
- 7,11518.0%Fire
- 6,36616.1%Hazardous Condition
- 3,7499.5%False Alarm
- 3,6079.1%Good Intent Call
- 2,2305.6%Service Call
- 2830.7%Special Incident
- 430.1%Overpressure Rupture
- Fire incident types reported to NFIRS in Brownsville, TX
- 3,54149.8%Outside Fires
- 1,78025.0%Structure Fires
- 1,42720.1%Mobile Property/Vehicle Fires
- 3675.2%Other
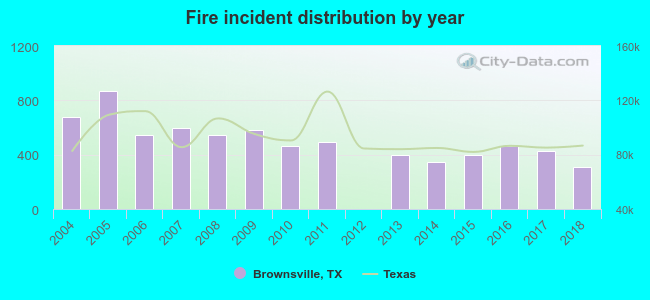 According to the data from the years 2004 - 2018 the average number of fires per year is 474. The highest number of fire incidents - 872 took place in 2005, and the least - 2 in 2012. The data has a declining trend.
The average number of yearly fire incidents per 10k residents in Brownsville, TX compared to nearest cities:
(Note: Based on data for the last 3 years, including only cities with population 5,000 and above)
| Brownsville: | 21.8 |
| Cameron Park: | 2.9 |
| Los Fresnos: | 120.5 |
| San Benito: | 68.7 |
| Lantana: | 3.4 |
| Port Isabel: | 5.3 |
| Harlingen: | 48.9 |
| La Feria: | 14.1 |
| Mercedes: | 51.4 |
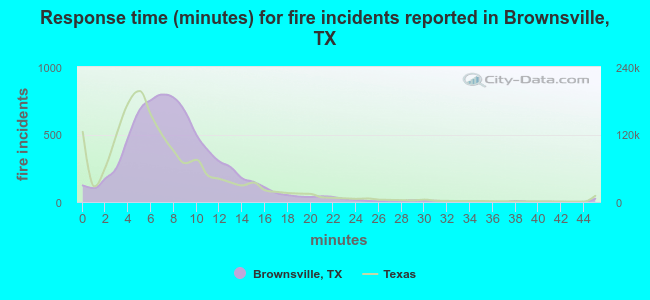 The median response time based on all reported fire incidents is 8 minutes. This is higher than the state median value.
The median response time in Brownsville, TX compared to nearest cities:
(Note: Based on data for all years, including only cities with at least 500 fire incidents)
| Brownsville: | 8 minutes |
| Los Fresnos: | 8 minutes |
| San Benito: | 5 minutes |
| Harlingen: | 7 minutes |
| Mercedes: | 9 minutes |
| Weslaco: | 7 minutes |
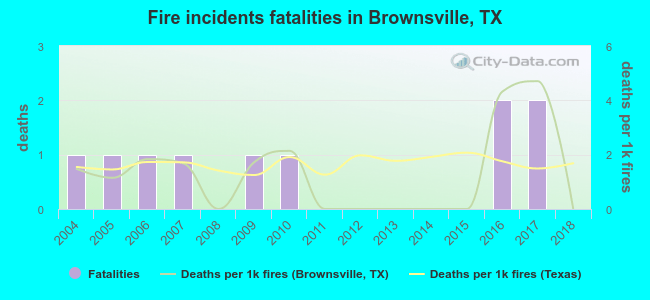 Based on the reports from the years 2004 - 2018 the average number of fire-related yearly deaths is 1. The highest number of reported deaths - 2 took place in 2016, and the lowest - 0 in 2008. The data has a decreasing trend.
The average number of deaths per 1,000 fire incidents is 1. This indicator was the highest - 5 in 2017, and the lowest 0 in 2008. The trend for fatalities per 1,000 incidents is dropping. Compared to the Texas value the number of fatalities per 1,000 fire incidents is similar.
Based on the reports from the years 2004 - 2018 the average number of fire-related yearly deaths is 1. The highest number of reported deaths - 2 took place in 2016, and the lowest - 0 in 2008. The data has a decreasing trend.
The average number of deaths per 1,000 fire incidents is 1. This indicator was the highest - 5 in 2017, and the lowest 0 in 2008. The trend for fatalities per 1,000 incidents is dropping. Compared to the Texas value the number of fatalities per 1,000 fire incidents is similar.Deaths per 1,000 incidents in Brownsville, TX compared to nearest cities:
(Note: Based on data for all years, including only cities with at least 2,500 fire incidents)
| Brownsville: | 1.4 |
| San Benito: | 0.7 |
| Harlingen: | 0.2 |
| Weslaco: | 0.7 |
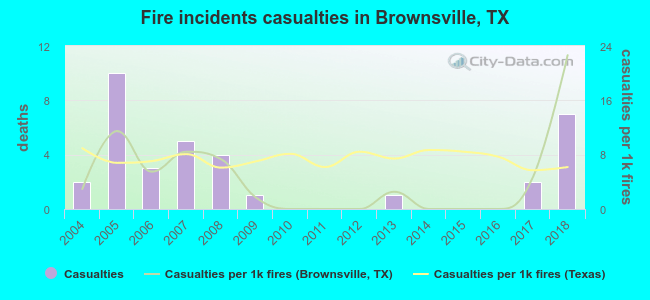 Based on the reports from the years 2004 - 2018 the average number of fire-related yearly casualties is 2. The highest number of reported casualties - 10 took place in 2005, and the lowest - 0 in 2010. The data has an increasing trend.
The average number of injuries per 1,000 fires is 4. This indicator was the highest - 23 in 2018, and the lowest 0 in 2010. The trend for casualties per 1,000 fire incidents is increasing. Compared to the state value the number of casualties per 1,000 fire incidents is lower.
Based on the reports from the years 2004 - 2018 the average number of fire-related yearly casualties is 2. The highest number of reported casualties - 10 took place in 2005, and the lowest - 0 in 2010. The data has an increasing trend.
The average number of injuries per 1,000 fires is 4. This indicator was the highest - 23 in 2018, and the lowest 0 in 2010. The trend for casualties per 1,000 fire incidents is increasing. Compared to the state value the number of casualties per 1,000 fire incidents is lower.Casualties per 1,000 incidents in Brownsville, TX compared to nearest cities:
(Note: Based on data for all years, including only cities with at least 500 fire incidents)
| Brownsville: | 4.9 |
| Los Fresnos: | 0.0 |
| San Benito: | 1.4 |
| Harlingen: | 4.7 |
| Mercedes: | 3.6 |
| Weslaco: | 4.0 |
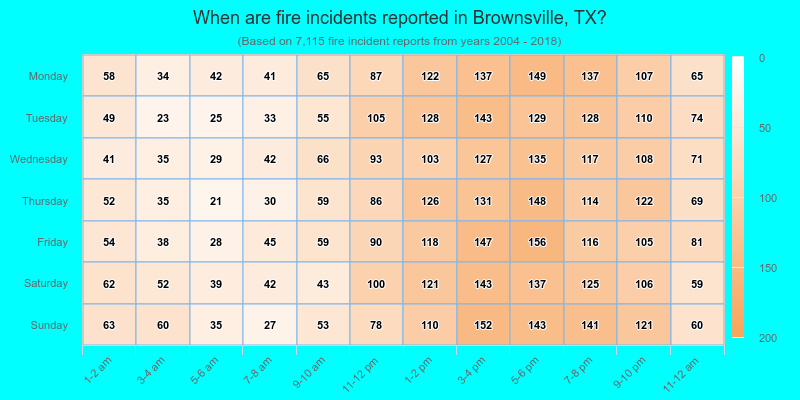
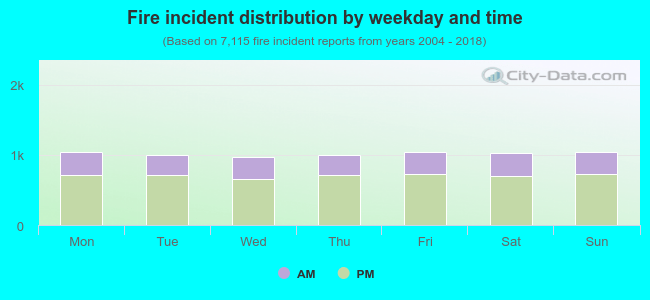 30.6% incidents where reported in the morning and 69.4% in the evening. The most fires (14.7%) took place on Monday, and the least (13.6%) on Wednesday.
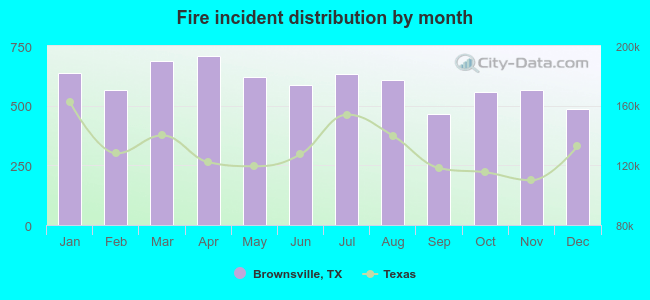 Based on the 7,115 incident reports from years 2004 - 2018 most fires (10.0%) took place during April, and the least (6.5%) in September.
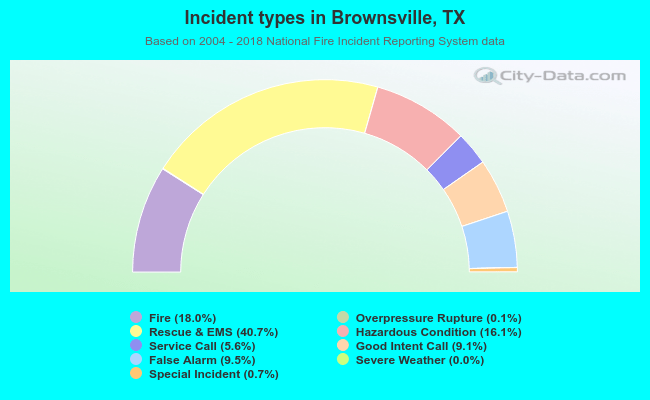 Out of all 39,485 cases reported during the years 2004 - 2018, the most belonged to the categories: Rescue & EMS (40.7%), Fire (18.0%), and Hazardous Condition (16.1%).
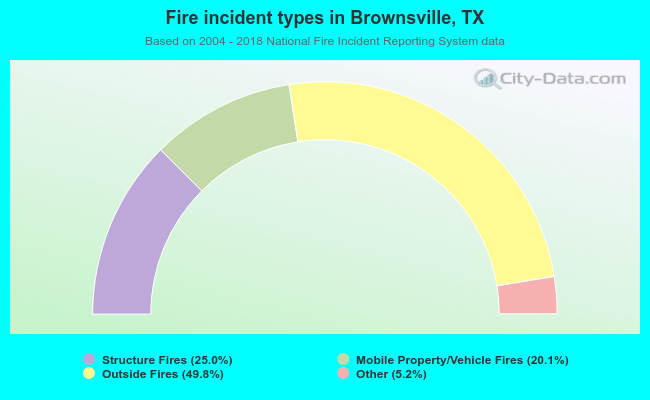 When looking into fire subcategories, the most reports belonged to: Outside Fires (49.8%), and Structure Fires (25.0%).