Brownsville: Fire Incidents, Pennsylvania (PA)
Where are fire incidents reported in Brownsville, PA
Something went wrong! Please refresh the page.
|
| |||||||||||||||||||||||||||||||||||||||||||||||||||||||||||||||||||||||||||||||||||||||||||||||||||||||||||||
2005 - 2018 National Fire Incident Reporting System (NFIRS) incidents
- Incident types reported to NFIRS in Brownsville, PA
- 44426.8%Fire
- 41224.8%Rescue & EMS
- 23214.0%Service Call
- 21713.1%False Alarm
- 1549.3%Hazardous Condition
- 1358.1%Good Intent Call
- 402.4%Severe Weather
- 251.5%Special Incident
- Fire incident types reported to NFIRS in Brownsville, PA
- 23352.5%Structure Fires
- 11425.7%Outside Fires
- 6715.1%Other
- 306.8%Mobile Property/Vehicle Fires
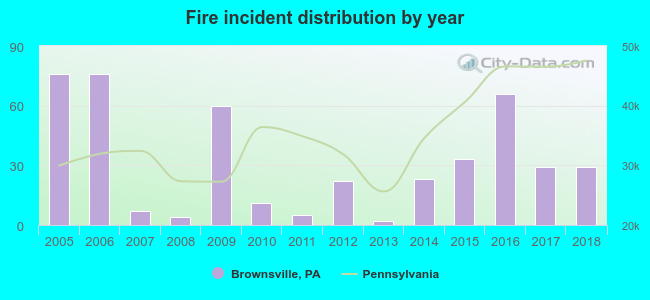 According to the data from the years 2005 - 2018 the average number of fire incidents per year is 32. The highest number of fires - 76 took place in 2005, and the least - 2 in 2013. The data has a decreasing trend.
 36.0% incidents where reported in the morning and 64.0% in the evening. The most fires (25.2%) took place on Saturday, and the least (9.7%) on Friday.
 Based on the 444 fires from years 2005 - 2018 most fires (15.3%) took place during April, and the least (5.4%) in October.
 Out of all 1,659 cases reported during the years 2005 - 2018, the most belonged to the categories: Fire (26.8%), Overpressure Rupture (24.8%), and Hazardous Condition (14.0%).
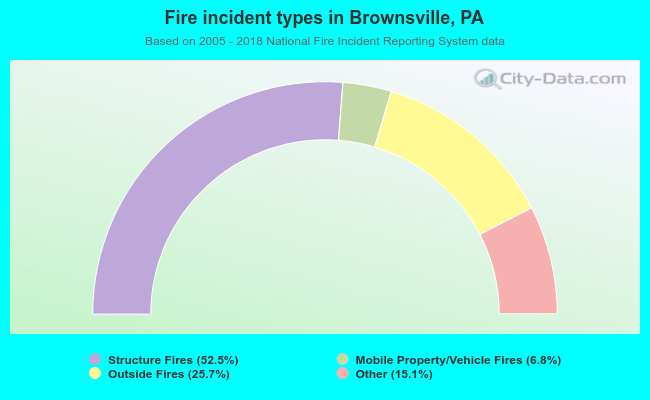 When looking into fire subcategories, the most reports belonged to: Structure Fires (52.5%), and Outside Fires (25.7%).