Brownstown: Fire Incidents, Pennsylvania (PA)
Where are fire incidents reported in Brownstown, PA
Something went wrong! Please refresh the page.
|
| |||||||||||||||||||||||||||||||||||||||||||||||||||||||||||||||||||||||||||||||||||||||||||||||||||||||||||||
2002 - 2018 National Fire Incident Reporting System (NFIRS) incidents
- Incident types reported to NFIRS in Brownstown, PA
- 36137.3%Fire
- 19620.2%Rescue & EMS
- 17418.0%Hazardous Condition
- 11111.5%Good Intent Call
- 889.1%Service Call
- 323.3%False Alarm
- 40.4%Special Incident
- 20.2%Severe Weather
- 10.1%Overpressure Rupture
- Fire incident types reported to NFIRS in Brownstown, PA
- 21860.4%Structure Fires
- 7119.7%Mobile Property/Vehicle Fires
- 5916.3%Outside Fires
- 133.6%Other
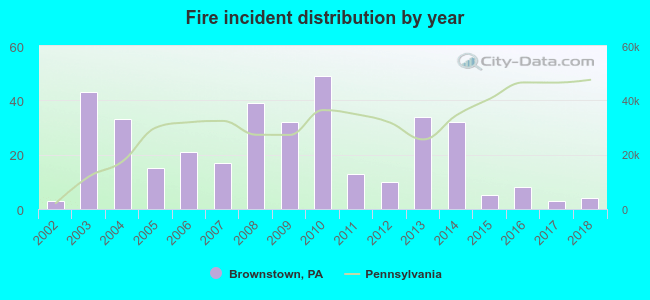 According to the data from the years 2002 - 2018 the average number of fire incidents per year is 21. The highest number of fires - 49 took place in 2010, and the least - 3 in 2002. The data has an increasing trend.
 32.7% incidents where reported in the morning and 67.3% in the evening. The most fires (15.8%) took place on Saturday, and the least (13.0%) on Friday.
 Based on the 361 fires from years 2002 - 2018 most fires (11.4%) took place during January, and the least (5.8%) in April.
 Out of all 969 cases reported during the years 2002 - 2018, the most belonged to the categories: Fire (37.3%), Rescue & EMS (20.2%), and Hazardous Condition (18.0%).
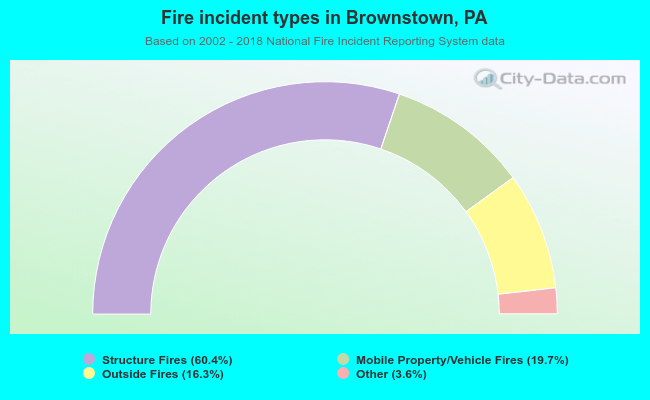 When looking into fire subcategories, the most reports belonged to: Structure Fires (60.4%), and Mobile Property/Vehicle Fires (19.7%).