| Fire incidents reported |
|---|
| Sreet name | Count |
|---|
| 1550 ST | 8 | | I70 EAST BOUND | 6 | | OAK GROVE TRAILER CT. | 6 | | 1/2M N OF 1850N ON 1600E | 4 | | 1/2M W OF 1150E ON 1850N | 4 | | 1/2M W OF 2400N & 1350E | 4 | | 1/4M E OF 1775E ON 1600N | 4 | | 1/4M N OF 1850N ON 1275E | 4 | | 1550 ST | 4 | | 1600 AVE | 4 | | 1625 ST | 4 | | 1775 ST | 4 | | 1850 AVE | 4 | | 1850N 1450E | 4 | | 2MI N OF 2300N ON 1600E | 4 | | I-70 | 4 | | 1/2M N OF 1850N ON 1200E | 2 | | 1/2M N OF 2100N ON 1725E | 2 | | 1/2M N OF 2200N ON 1350E | 2 | | 1/2M N OF 2225N ON 1550E | 2 | | 1/2M N OF 2300N ON 1450E | 2 | | 1/2M N OF 2450N ON 1850E | 2 | | 1/2M N OF RT 185 ON 1825E | 2 | | 1/2M S OF 1625N ON 1550E | 2 | | 1/2M S OF RT40 ON 1750E | 2 |
| | | Fire incidents reported |
|---|
| Sreet name | Count |
|---|
| 1/2M W OF 1150W ON 1850N | 2 | | 1/2M W OF 1575E ON RT 185 | 2 | | 1/2M W OF 1700E ON 1275N | 2 | | 1/2M W OF 460 W SOUTH ST | 2 | | 1/2M W OF NORTH ST & WEST ST | 2 | | 1/2MI E 1600E ON 2000N | 2 | | 1/4 M W OF US RT 40 & RT 185 | 2 | | 1/4M E OF 1325E ON 1850N | 2 | | 1/4M E OF 1725E ON 2100N | 2 | | 1/4M E OF 1775E ON 1700N | 2 | | 1/4M N OF 1850N ON 1600E | 2 | | 1/4M N OF 2100N ON 1800E | 2 | | 1/4M N OF RT 40 ON 1470E | 2 | | 1/4M S OF 1750N ON 1150E | 2 | | 1/4M S OF 2300N ON 1550E | 2 | | 1/4M W OF 1450E ON 1850N | 2 | | 1/4M W OF 1775E ON 1550N | 2 | | 1/4M W OF 2100N & 1600E | 2 | | 1/8M N OF 2150N ON 1350E | 2 | | 1/8M N RT40 ON 1700E | 2 | | 1/8M W OF 1550E ON 1725N | 2 | | 1000N & 2000E | 2 | | 103E CUMBERLAND RD | 2 | | 112 W MAIN ST | 2 | | |
|
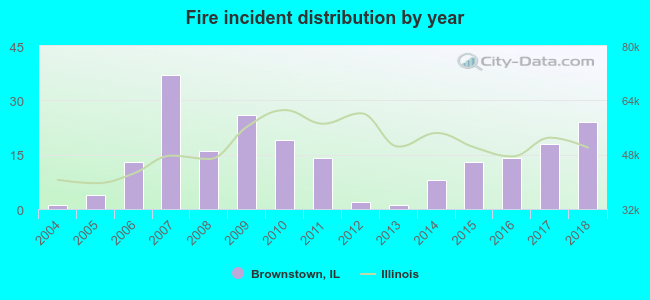 According to the data from the years 2004 - 2018 the average number of fires per year is 14. The highest number of fires - 37 took place in 2007, and the least - 1 in 2004. The data has a growing trend.
 30.0% incidents where reported in the morning and 70.0% in the evening. The most fires (20.0%) took place on Sunday, and the least (9.0%) on Wednesday.
 Based on the 210 fire incident reports from years 2004 - 2018 most fires (10.5%) took place during March, and the least (6.7%) in July.
 Out of all 693 cases reported during the years 2004 - 2018, the most belonged to the categories: Rescue & EMS (53.0%), Fire (30.3%), and Service Call (5.6%).
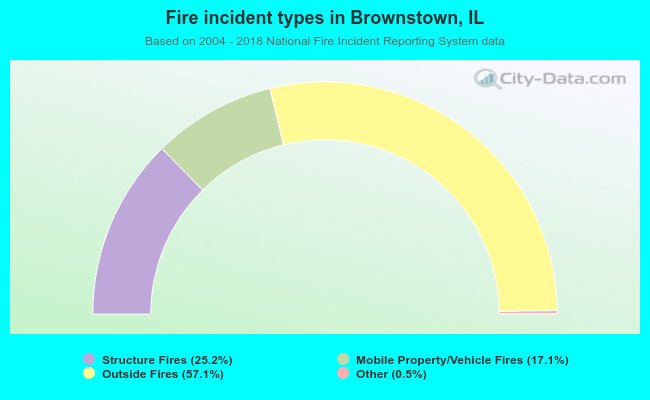 When looking into fire subcategories, the most reports belonged to: Outside Fires (57.1%), and Structure Fires (25.2%).