Brookville: Fire Incidents, Pennsylvania (PA)
Where are fire incidents reported in Brookville, PA
Something went wrong! Please refresh the page.
|
| |||||||||||||||||||||||||||||||||||||||||||||||||||||||||||||||||||||||||||||||||||||||||||||||||||||||||||||
2004 - 2018 National Fire Incident Reporting System (NFIRS) incidents
- Incident types reported to NFIRS in Brookville, PA
- 88554.2%Hazardous Condition
- 34721.2%Fire
- 20612.6%Rescue & EMS
- 654.0%Service Call
- 593.6%False Alarm
- 392.4%Good Intent Call
- 211.3%Special Incident
- 90.6%Severe Weather
- 20.1%Overpressure Rupture
- Fire incident types reported to NFIRS in Brookville, PA
- 18854.2%Structure Fires
- 7220.7%Outside Fires
- 6418.4%Mobile Property/Vehicle Fires
- 236.6%Other
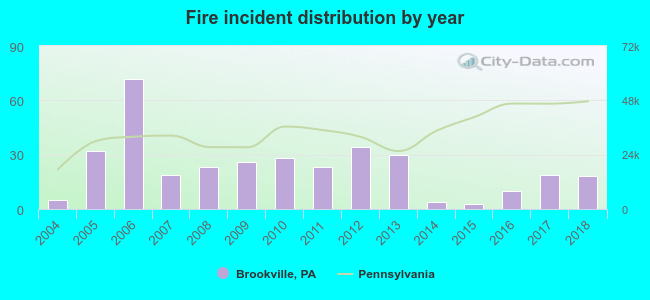 Based on the data from the years 2004 - 2018 the average number of fires per year is 23. The highest number of fire incidents - 72 took place in 2006, and the least - 3 in 2015. The data has a growing trend.
 37.5% incidents where reported in the morning and 62.5% in the evening. The most fires (19.0%) took place on Saturday, and the least (10.7%) on Friday.
 Based on the 347 incident reports from years 2004 - 2018 most fires (14.1%) took place during March, and the least (3.2%) in October.
 Out of all 1,633 cases reported during the years 2004 - 2018, the most belonged to the categories: Hazardous Condition (54.2%), Fire (21.2%), and Rescue & EMS (12.6%).
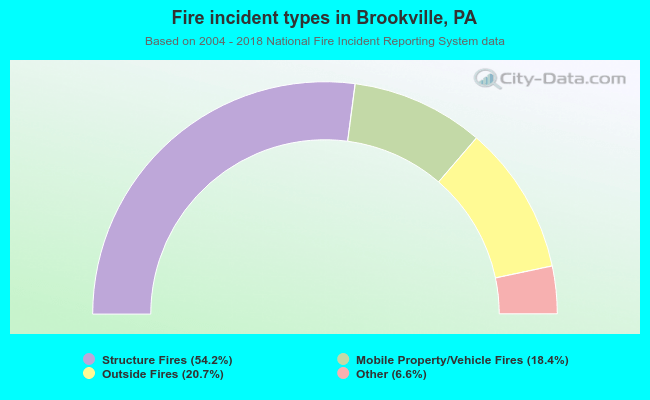 When looking into fire subcategories, the most reports belonged to: Structure Fires (54.2%), and Outside Fires (20.7%).