Brimfield: Fire Incidents, Illinois (IL)
Where are fire incidents reported in Brimfield, IL
Something went wrong! Please refresh the page.
|
| |||||||||||||||||||||||||||||||||||||||||||||||||||||||||||||||||||||||||||||||||||||||||||||||||||||||||||||
2002 - 2018 National Fire Incident Reporting System (NFIRS) incidents
- Incident types reported to NFIRS in Brimfield, IL
- 71358.9%Rescue & EMS
- 26922.2%Fire
- 1038.5%Good Intent Call
- 665.5%Hazardous Condition
- 312.6%False Alarm
- 201.7%Service Call
- 70.6%Severe Weather
- Fire incident types reported to NFIRS in Brimfield, IL
- 12446.1%Outside Fires
- 8230.5%Structure Fires
- 5520.4%Mobile Property/Vehicle Fires
- 83.0%Other
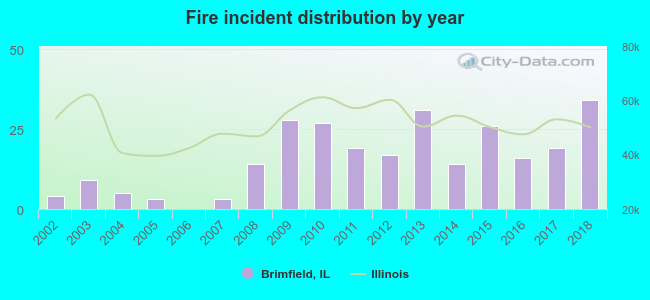 According to the data from the years 2002 - 2018 the average number of fires per year is 16. The highest number of fires - 34 took place in 2018, and the least - 0 in 2006. The data has a growing trend.
 28.3% incidents where reported in the morning and 71.7% in the evening. The most fires (19.0%) took place on Saturday, and the least (10.0%) on Thursday.
 Based on the 269 fire incident reports from years 2002 - 2018 most fires (19.3%) took place during March, and the least (2.2%) in December.
 Out of all 1,211 cases reported during the years 2002 - 2018, the most belonged to the categories: Rescue & EMS (58.9%), Fire (22.2%), and Good Intent Call (8.5%).
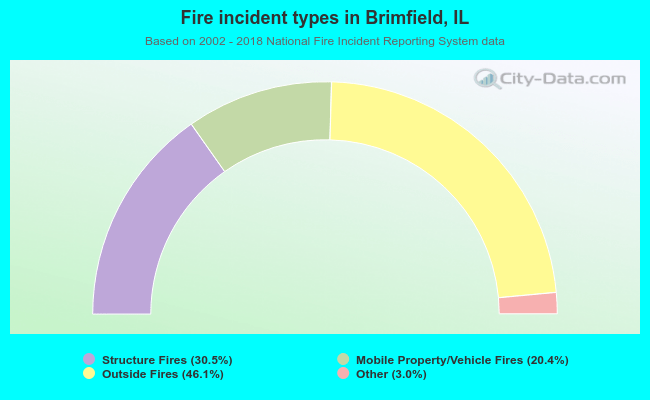 When looking into fire subcategories, the most reports belonged to: Outside Fires (46.1%), and Structure Fires (30.5%).