Brillion: Fire Incidents, Wisconsin (WI)
Where are fire incidents reported in Brillion, WI
Something went wrong! Please refresh the page.
|
| |||||||||||||||||||||||||||||||||||||||||||||||||||||||||||||||||||||||||||||||||||||||||||||||||||||||||||||
2004 - 2018 National Fire Incident Reporting System (NFIRS) incidents
- Incident types reported to NFIRS in Brillion, WI
- 20142.4%Fire
- 7716.2%Hazardous Condition
- 6313.3%Rescue & EMS
- 5110.8%False Alarm
- 367.6%Service Call
- 245.1%Good Intent Call
- 112.3%Special Incident
- 102.1%Severe Weather
- 10.2%Overpressure Rupture
- Fire incident types reported to NFIRS in Brillion, WI
- 9245.8%Structure Fires
- 4924.4%Other
- 4019.9%Outside Fires
- 2010.0%Mobile Property/Vehicle Fires
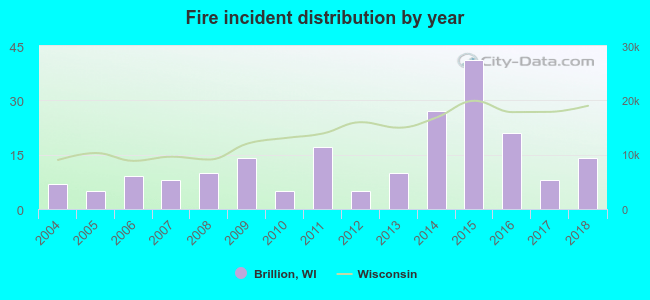 According to the data from the years 2004 - 2018 the average number of fires per year is 13. The highest number of fire incidents - 41 took place in 2015, and the least - 5 in 2005. The data has a growing trend.
 46.8% incidents where reported in the morning and 53.2% in the evening. The most fires (19.9%) took place on Wednesday, and the least (10.0%) on Friday.
 According to the 201 fire incident reports from years 2004 - 2018 most fires (14.4%) took place during April, and the least (4.5%) in October.
 Out of all 474 cases reported during the years 2004 - 2018, the most belonged to the categories: Fire (42.4%), Hazardous Condition (16.2%), and Rescue & EMS (13.3%).
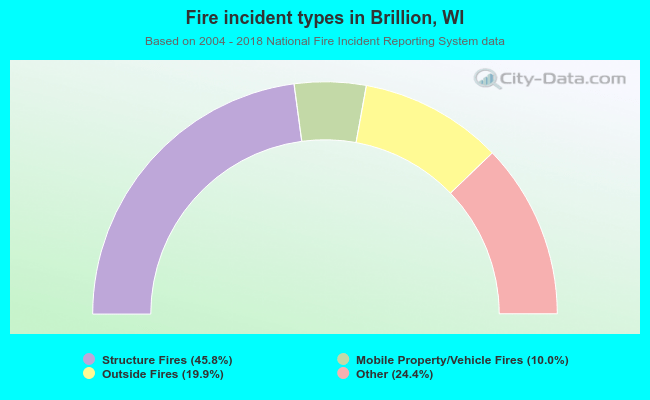 When looking into fire subcategories, the most incidents belonged to: Structure Fires (45.8%), and Other (24.4%).