| Fire incidents reported |
|---|
| Sreet name | Count |
|---|
| RR1 | 34 | | 800E | 14 | | MAIN ST | 8 | | ROUTE 1 | 8 | | STATE ST | 8 | | ADAMS ST | 6 | | CHESTNUT ST | 6 | | CHURCH ST | 6 | | CORPORATION ST | 6 | | JUDY AVE | 6 | | LEXINGTON ST | 6 | | OLIVE | 6 | | 600 MADISON | 4 | | 800 EAST LAWRENCE COUNTY | 4 | | 800E 400N | 4 | | 800N 600E | 4 | | 844 WASHINGTON | 4 | | 8756 STATE ROAD 250 | 4 | | ASH ST | 4 | | CORPORATION ST | 4 | | GRAY ST | 4 | | IL 250 | 4 | | KINGS HILL RD | 4 | | MAIN ST | 4 | | OAK ST | 4 |
| | | Fire incidents reported |
|---|
| Sreet name | Count |
|---|
| RR 1 | 4 | | RR3 | 4 | | WEST CHESTNUT | 4 | | 10 HONEYSUCKLE LANE | 2 | | 1000 BLOCK OAK ST. | 2 | | 1000E 800N | 2 | | 1010 MADISON | 2 | | 10183 BRIDGEPORT ROAD | 2 | | 10531 VIRGINIA RD | 2 | | 11225 SIMMONS DRIVE | 2 | | 1131 MAIN STREET | 2 | | 1131 NORTH MAIN | 2 | | 1200 NORTH | 2 | | 1245 JUDY AVENUE | 2 | | 1249 JUDY | 2 | | 1300 NORTH AND 670 EAST | 2 | | 1300N X 700E | 2 | | 1350 N 800E | 2 | | 1500 NORTH 450 EAST | 2 | | 1500N X 600E | 2 | | 155 EAST CHESTNUT | 2 | | 2200 NORTH KINGS HILL ROAD | 2 | | 250 HWY | 2 | | 285 SOUTH MAIN | 2 | | |
|
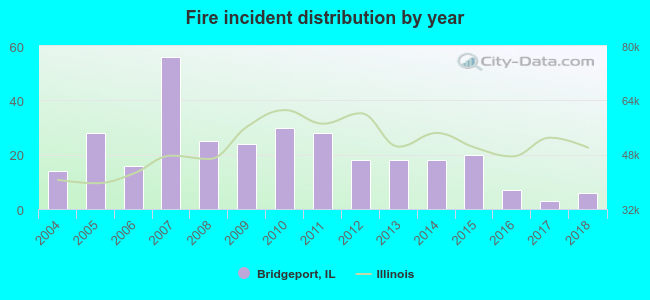 According to the data from the years 2004 - 2018 the average number of fire incidents per year is 21. The highest number of reported fires - 56 took place in 2007, and the least - 3 in 2017. The data has a decreasing trend.
 38.1% incidents where reported in the morning and 61.9% in the evening. The most fires (16.7%) took place on Wednesday, and the least (12.5%) on Friday.
 Based on the 312 fires from years 2004 - 2018 most fires (13.5%) took place during October, and the least (3.8%) in June.
 Out of all 388 cases reported during the years 2004 - 2018, the most belonged to the categories: Fire (80.4%), Good Intent Call (10.8%), and Hazardous Condition (4.4%).
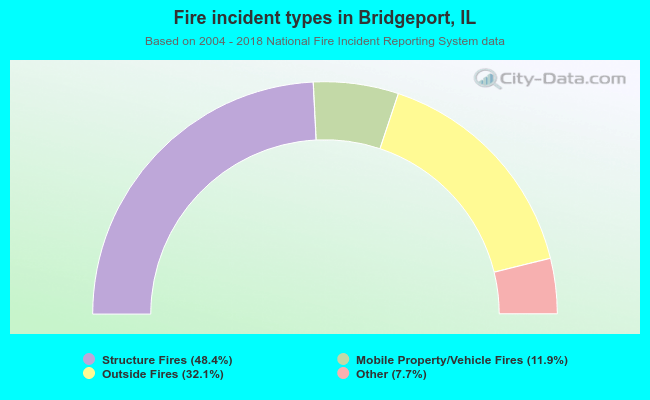 When looking into fire subcategories, the most reports belonged to: Structure Fires (48.4%), and Outside Fires (32.1%).