| Fire incidents reported |
|---|
| Sreet name | Count |
|---|
| OLD US 50 | 16 | | HIGHLINE ROAD | 8 | | HOLY CROSS LN | 8 | | WALNUT | 8 | | 2ND ST | 6 | | GERMANTOWN ROAD | 6 | | OLD STATE RD | 6 | | OLD STATE ROAD | 6 | | PLUM ST | 6 | | 11 TH STRE | 4 | | 1155 NORTH 1ST STREET | 4 | | 2 ND STRE | 4 | | 2ND | 4 | | 3 RD | 4 | | 4 TH STRE | 4 | | 4TH ST | 4 | | 6 TH STRE | 4 | | 6TH ST | 4 | | 9 TH | 4 | | BREESE RD | 4 | | BROADWAY | 4 | | DRIVE INN ROAD | 4 | | JAMESTOWN ROAD | 4 | | LITTLE PRAIRIE RD | 4 | | MAIN ST. | 4 |
| | | Fire incidents reported |
|---|
| Sreet name | Count |
|---|
| PLUM | 4 | | ROD AND GUN RD | 4 | | ST ROSE ROAD | 4 | | TUNE RD. | 4 | | 1 ST STRE | 2 | | 10310 BREESE RD. | 2 | | 10808 HOLY CROSS LN | 2 | | 10919 KAMPWERTH RD | 2 | | 10TH ST | 2 | | 1111 LAKEVIEW DRIVE | 2 | | 11156 LINDEN GROOVE ROAD | 2 | | 11303 LITTLE PRAIRE RD | 2 | | 11303 LITTLE PRAIRIE ROAD | 2 | | 11304 OLD STATE RD. | 2 | | 1150 N. 4TH | 2 | | 1155 N. 1 ST. | 2 | | 1155 N. IST | 2 | | 11601 GERMANTOWN RD. | 2 | | 1174 N. 11TH. | 2 | | 11TH | 2 | | 12018 HIMES RD. | 2 | | 12424 LITTLE PR. RD | 2 | | 12502 LINDEN GROVE RD. | 2 | | 12900 DORRIES DR. | 2 | | |
|
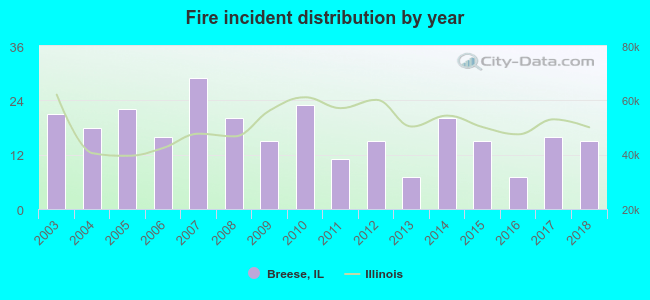 According to the data from the years 2003 - 2018 the average number of fire incidents per year is 17. The highest number of reported fires - 29 took place in 2007, and the least - 7 in 2013. The data has a decreasing trend.
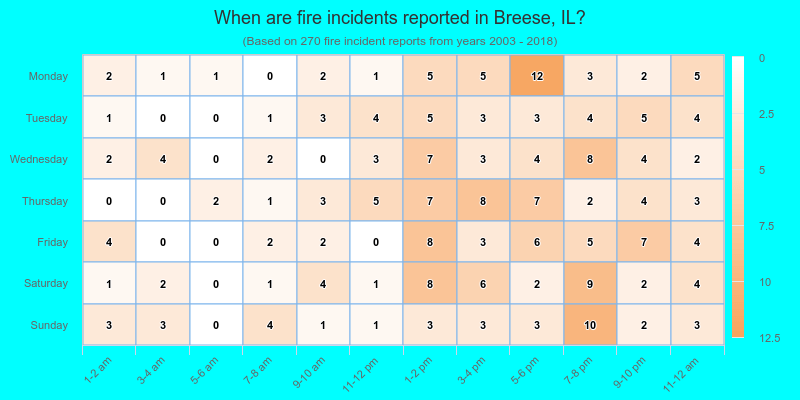
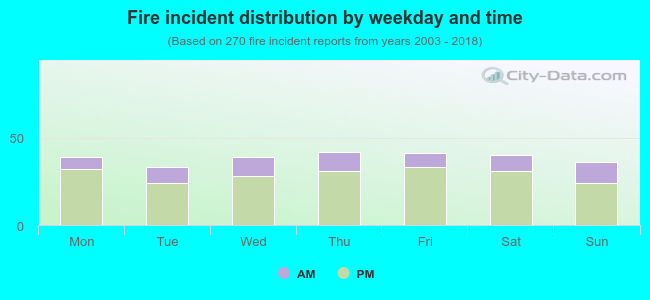 24.8% incidents where reported in the morning and 75.2% in the evening. The most fires (15.6%) took place on Thursday, and the least (12.2%) on Tuesday.
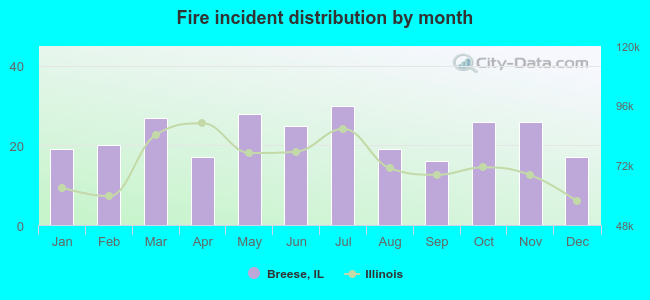 Based on the 270 fires from years 2003 - 2018 most fires (11.1%) took place during July, and the least (5.9%) in September.
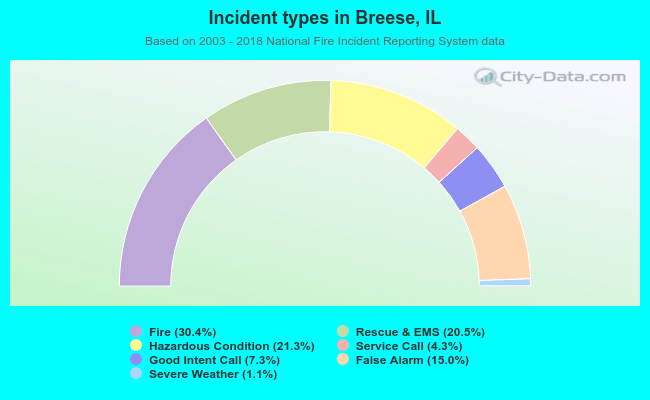 Out of all 887 cases reported during the years 2003 - 2018, the most belonged to the categories: Fire (30.4%), Rescue & EMS (21.3%), and Overpressure Rupture (20.5%).
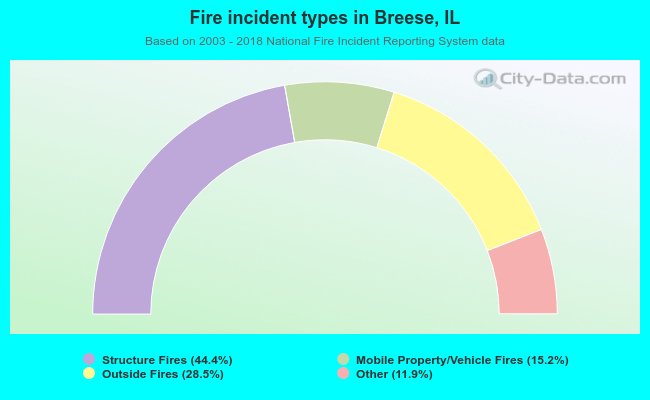 When looking into fire subcategories, the most reports belonged to: Structure Fires (44.4%), and Outside Fires (28.5%).