Brazoria: Fire Incidents, Texas (TX)
Where are fire incidents reported in Brazoria, TX
Something went wrong! Please refresh the page.
|
| |||||||||||||||||||||||||||||||||||||||||||||||||||||||||||||||||||||||||||||||||||||||||||||||||||||||||||||
| Other | 101 | |||||||||||||||||||||||||||||||||||||||||||||||||||||||||||||||||||||||||||||||||||||||||||||||||||||||||||||
2002 - 2018 National Fire Incident Reporting System (NFIRS) incidents
- Incident types reported to NFIRS in Brazoria, TX
- 88144.4%Fire
- 39820.1%Rescue & EMS
- 28314.3%Hazardous Condition
- 26213.2%Good Intent Call
- 1276.4%Service Call
- 160.8%False Alarm
- 60.3%Overpressure Rupture
- 60.3%Severe Weather
- 40.2%Special Incident
- Fire incident types reported to NFIRS in Brazoria, TX
- 45051.1%Outside Fires
- 32036.3%Structure Fires
- 788.9%Mobile Property/Vehicle Fires
- 333.7%Other
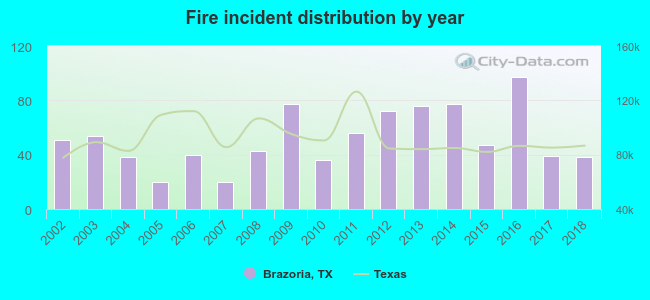 Based on the data from the years 2002 - 2018 the average number of fires per year is 52. The highest number of fires - 97 took place in 2016, and the least - 20 in 2005. The data has a dropping trend.
 The median response time based on all reported fire incidents is 8 minutes. This is higher compared to the Texas median value.
The median response time in Brazoria, TX compared to nearest cities:
(Note: Based on data for all years, including only cities with at least 500 fire incidents)
| Brazoria: | 8 minutes |
| Lake Jackson: | 9 minutes |
| Clute: | 6 minutes |
| Angleton: | 5 minutes |
| Freeport: | 7 minutes |
| Rosharon: | 10 minutes |
| Bay City: | 7 minutes |
| Alvin: | 7 minutes |
| Manvel: | 7 minutes |
 Based on the data from the years 2002 - 2018 the average number of fire-related yearly deaths is 0. The highest number of deaths - 1 took place in 2004, and the lowest - 0 in 2002. The data has a constant trend.
 26.3% incidents where reported in the morning and 73.7% in the evening. The most fires (16.6%) took place on Thursday, and the least (11.8%) on Tuesday.
 According to the 881 fires from years 2002 - 2018 most fires (14.2%) took place during January, and the least (4.7%) in September.
 Out of all 1,983 cases reported during the years 2002 - 2018, the most belonged to the categories: Fire (44.4%), Rescue & EMS (20.1%), and Hazardous Condition (14.3%).
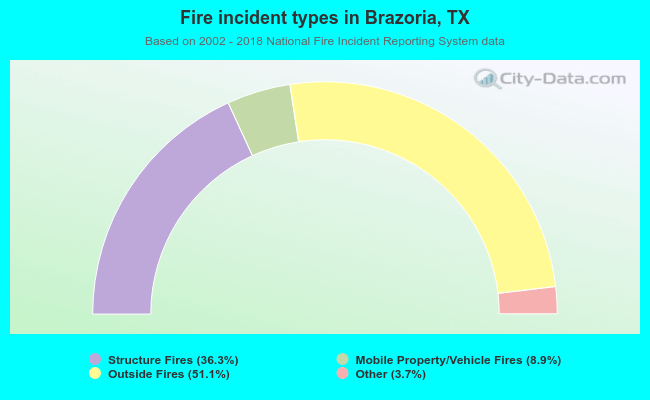 When looking into fire subcategories, the most reports belonged to: Outside Fires (51.1%), and Structure Fires (36.3%).