Branford: Fire Incidents, Florida (FL)
Where are fire incidents reported in Branford, FL
Something went wrong! Please refresh the page.
|
| |||||||||||||||||||||||||||||||||||||||||||||||||||||||||||||||||||||||||||||||||||||||||||||||||||||||||||||
| Other | 81 | |||||||||||||||||||||||||||||||||||||||||||||||||||||||||||||||||||||||||||||||||||||||||||||||||||||||||||||
2002 - 2018 National Fire Incident Reporting System (NFIRS) incidents
- Incident types reported to NFIRS in Branford, FL
- 71144.8%Rescue & EMS
- 37523.6%Fire
- 31619.9%Hazardous Condition
- 815.1%Good Intent Call
- 422.6%Service Call
- 322.0%False Alarm
- 271.7%Severe Weather
- 40.3%Special Incident
- Fire incident types reported to NFIRS in Branford, FL
- 20855.5%Outside Fires
- 8823.5%Structure Fires
- 7419.7%Mobile Property/Vehicle Fires
- 51.3%Other
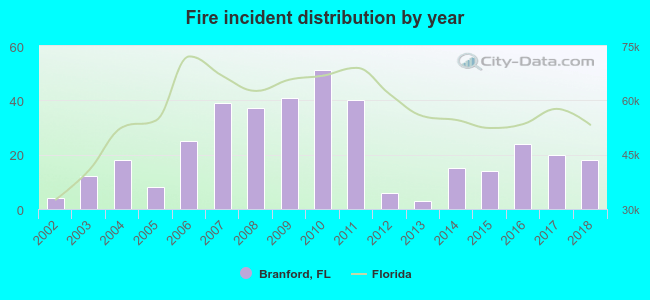 Based on the data from the years 2002 - 2018 the average number of fires per year is 22. The highest number of fire incidents - 51 took place in 2010, and the least - 3 in 2013. The data has a growing trend.
 21.6% incidents where reported in the morning and 78.4% in the evening. The most fires (16.0%) took place on Saturday, and the least (12.8%) on Thursday.
 Based on the 375 fire incident reports from years 2002 - 2018 most fires (14.7%) took place during May, and the least (3.7%) in August.
 Out of all 1,588 cases reported during the years 2002 - 2018, the most belonged to the categories: Overpressure Rupture (44.8%), Fire (23.6%), and Rescue & EMS (19.9%).
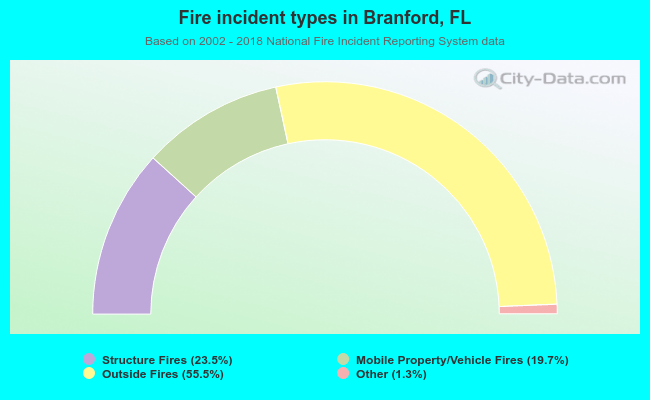 When looking into fire subcategories, the most reports belonged to: Outside Fires (55.5%), and Structure Fires (23.5%).