| Fire incidents reported |
|---|
| Sreet name | Count |
|---|
| CALDWELL RD | 36 | | BRADNER RD | 24 | | BRADNER ROAD RT | 18 | | BELL ST | 16 | | CHURCH ST | 14 | | PEMBERVILLE RD | 14 | | CROCKER ST | 10 | | GREENSBURG PIKE | 10 | | MAIN ST | 10 | | MERMILL RD | 10 | | CALDWELL ST | 8 | | CO RD 41 | 8 | | COUNTY ROAD 49 RD | 8 | | DOUGLAS RD | 8 | | DOUGLAS ROAD RD | 8 | | EAST ST | 8 | | STAHL ST | 8 | | BOWLING GREEN ROAD E | 6 | | CHERRY ST | 6 | | GREENSBURG PIKE | 6 | | HILL RD | 6 | | PLIN ST | 6 | | US 6 HWY | 6 | | WAYNE ROAD RD | 6 | | BLACKMAN RD | 4 |
| | | Fire incidents reported |
|---|
| Sreet name | Count |
|---|
| CASKIE RD | 4 | | COUNTY ROAD 41 | 4 | | FOSTORIA ROAD RD | 4 | | US 23 HWY | 4 | | WOLLAM RD | 4 | | 1213 CALDWELL ST | 2 | | 1236 CALDWELL ST. | 2 | | 45 HWY | 2 | | 6910 CR 49 | 2 | | 693 CR 45 | 2 | | BOWLING GREEN ROAD E. | 2 | | C R 45 | 2 | | COUNTY ROAD 33 RD | 2 | | COUNTY ROAD 45 RD | 2 | | COUNTY ROAD 55 RD | 2 | | CR45 | 2 | | EAST ST AND TIMMONS RD | 2 | | ELMORE RD | 2 | | EUCLID AVE | 2 | | EVANS ST | 2 | | FOSTORIA RD | 2 | | GIBSONBURG RD | 2 | | GIBSONBURG RDS | 2 | | GREENSBURG PIKE AND BRADN | 2 | | |
|
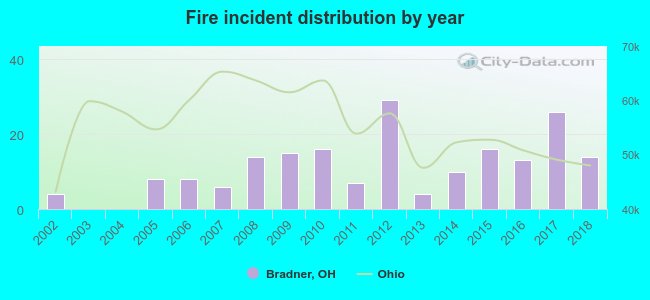 Based on the data from the years 2002 - 2018 the average number of fires per year is 11. The highest number of reported fire incidents - 29 took place in 2012, and the least - 0 in 2003. The data has a growing trend.
 33.2% incidents where reported in the morning and 66.8% in the evening. The most fires (17.9%) took place on Monday, and the least (10.5%) on Wednesday.
 Based on the 190 fire incidents from years 2002 - 2018 most fires (14.2%) took place during July, and the least (5.3%) in March.
 Out of all 243 cases reported during the years 2002 - 2018, the most belonged to the categories: Fire (78.2%), Good Intent Call (7.8%), and Rescue & EMS (7.0%).
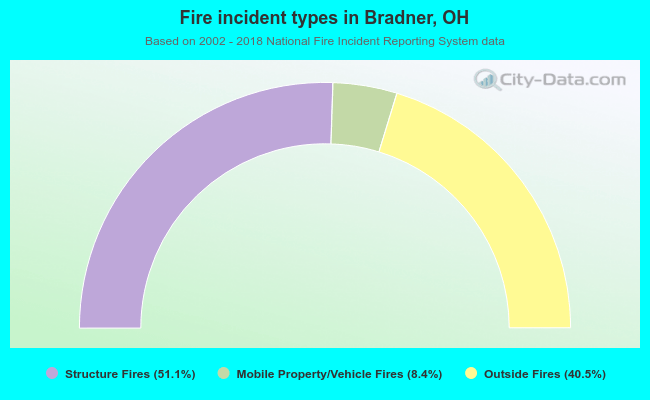 When looking into fire subcategories, the most incidents belonged to: Structure Fires (51.1%), and Outside Fires (40.5%).