Braddock: Fire Incidents, Pennsylvania (PA)
Where are fire incidents reported in Braddock, PA
Something went wrong! Please refresh the page.
|
| |||||||||||||||||||||||||||||||||||||||||||||||||||||||||||||||||||||||||||||||||||||||||||||||||||||||||||||
2004 - 2018 National Fire Incident Reporting System (NFIRS) incidents
- Incident types reported to NFIRS in Braddock, PA
- 35931.4%Fire
- 25522.3%Good Intent Call
- 21418.7%Hazardous Condition
- 16914.8%False Alarm
- 766.6%Rescue & EMS
- 675.9%Service Call
- 20.2%Severe Weather
- Fire incident types reported to NFIRS in Braddock, PA
- 26573.8%Structure Fires
- 4111.4%Outside Fires
- 308.4%Mobile Property/Vehicle Fires
- 236.4%Other
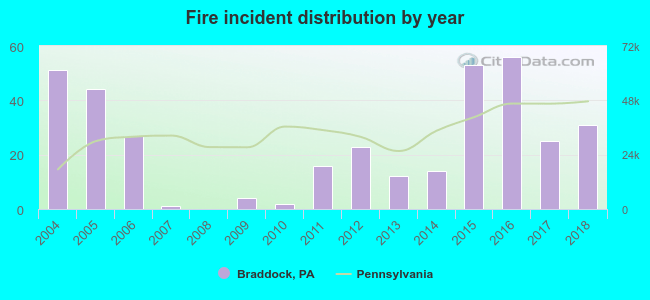 Based on the data from the years 2004 - 2018 the average number of fire incidents per year is 24. The highest number of reported fire incidents - 56 took place in 2016, and the least - 0 in 2008. The data has a decreasing trend.
 27.6% incidents where reported in the morning and 72.4% in the evening. The most fires (16.4%) took place on Monday, and the least (12.5%) on Wednesday.
 According to the 359 incident reports from years 2004 - 2018 most fires (10.6%) took place during June, and the least (6.1%) in May.
 Out of all 1,144 cases reported during the years 2004 - 2018, the most belonged to the categories: Fire (31.4%), Good Intent Call (22.3%), and Hazardous Condition (18.7%).
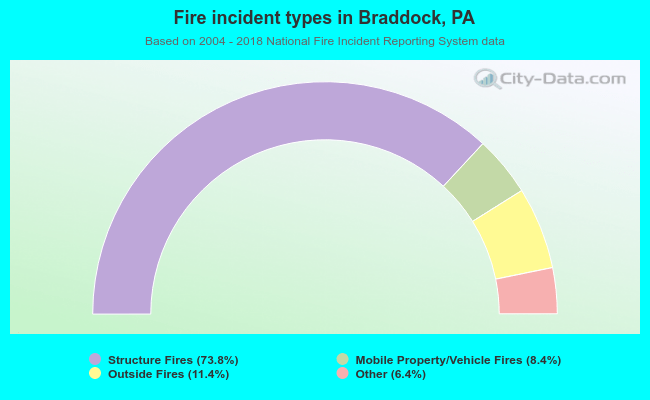 When looking into fire subcategories, the most incidents belonged to: Structure Fires (73.8%), and Outside Fires (11.4%).