Boyceville: Fire Incidents, Wisconsin (WI)
Where are fire incidents reported in Boyceville, WI
Something went wrong! Please refresh the page.
|
| |||||||||||||||||||||||||||||||||||||||||||||||||||||||||||||||||||||||||||||||||||||||||||||||||||||||||||||
| Other | 40 | |||||||||||||||||||||||||||||||||||||||||||||||||||||||||||||||||||||||||||||||||||||||||||||||||||||||||||||
2004 - 2018 National Fire Incident Reporting System (NFIRS) incidents
- Incident types reported to NFIRS in Boyceville, WI
- 17855.3%Fire
- 5416.8%Rescue & EMS
- 329.9%Hazardous Condition
- 216.5%Service Call
- 216.5%Good Intent Call
- 123.7%False Alarm
- 20.6%Severe Weather
- 10.3%Overpressure Rupture
- 10.3%Special Incident
- Fire incident types reported to NFIRS in Boyceville, WI
- 8648.3%Structure Fires
- 6436.0%Outside Fires
- 1910.7%Mobile Property/Vehicle Fires
- 95.1%Other
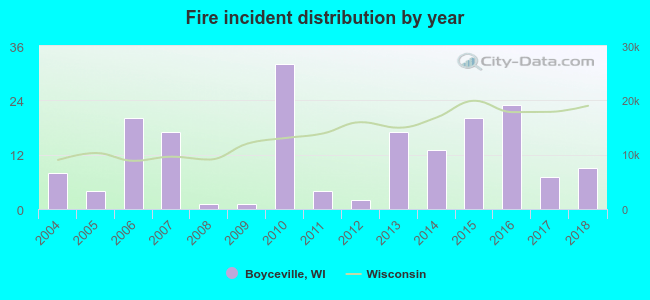 According to the data from the years 2004 - 2018 the average number of fires per year is 12. The highest number of fire incidents - 32 took place in 2010, and the least - 1 in 2008. The data has a growing trend.
 23.0% incidents where reported in the morning and 77.0% in the evening. The most fires (17.4%) took place on Tuesday, and the least (9.0%) on Wednesday.
 According to the 178 fire incident reports from years 2004 - 2018 most fires (20.8%) took place during April, and the least (3.4%) in December.
 Out of all 322 cases reported during the years 2004 - 2018, the most belonged to the categories: Fire (55.3%), Rescue & EMS (16.8%), and Hazardous Condition (9.9%).
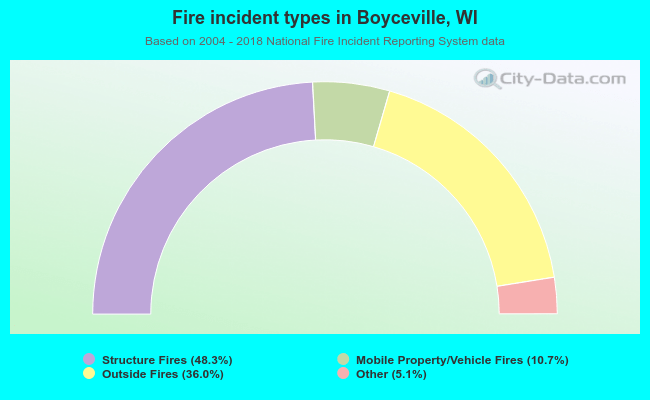 When looking into fire subcategories, the most incidents belonged to: Structure Fires (48.3%), and Outside Fires (36.0%).