Bowling Green: Fire Incidents, Ohio (OH)
Where are fire incidents reported in Bowling Green, OH
Something went wrong! Please refresh the page.
| Fire incidents reported | |
|---|---|
| Sreet name | Count |
| MAIN ST | 172 |
| WOOSTER ST | 120 |
| NAPOLEON RD | 80 |
| CLOUGH ST | 44 |
| ENTERPRISE ST | 42 |
| RIDGE ST | 42 |
| MANVILLE AVE | 40 |
| COLLEGE DR | 36 |
| DIXIE HWY | 36 |
| FAIRVIEW AVE | 34 |
| POE RD | 32 |
| THIRD ST | 32 |
| CROSS CREEK RD | 30 |
| GYPSY LANE RD | 30 |
| MERRY AVE | 30 |
| PROSPECT ST | 30 |
| SUMMIT ST | 30 |
| CAMPBELL HILL RD | 26 |
| DUNBRIDGE RD | 26 |
| MERCER RD | 26 |
| BRIM RD | 24 |
| I75 HWY | 24 |
| KELLOGG RD | 24 |
| KLOTZ RD | 24 |
| KRAMER RD | 24 |
| LIBERTY HI RD | 24 |
| RIVER RD | 24 |
| SIXTH ST | 22 |
| DEVILS HOLE RD | 20 |
| BISHOP RD | 18 |
2002 - 2018 National Fire Incident Reporting System (NFIRS) incidents
- Incident types reported to NFIRS in Bowling Green, OH
- 7,13761.6%Rescue & EMS
- 1,1429.9%Fire
- 1,0639.2%Good Intent Call
- 9568.2%Hazardous Condition
- 6585.7%Service Call
- 5855.0%False Alarm
- 250.2%Overpressure Rupture
- 210.2%Special Incident
- Fire incident types reported to NFIRS in Bowling Green, OH
- 51945.4%Outside Fires
- 43738.3%Structure Fires
- 18015.8%Mobile Property/Vehicle Fires
- 60.5%Other
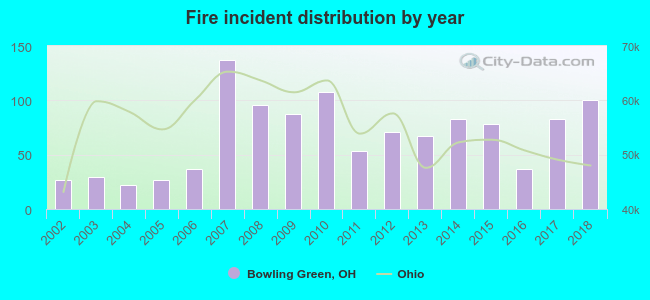 Based on the data from the years 2002 - 2018 the average number of fires per year is 67. The highest number of reported fire incidents - 137 took place in 2007, and the least - 22 in 2004. The data has a growing trend.
The average number of yearly fire incidents per 10k residents in Bowling Green, OH compared to nearest cities:
(Note: Based on data for the last 3 years, including only cities with population 5,000 and above)
| Bowling Green: | 23.2 |
| Waterville: | 43.5 |
| Perrysburg: | 46.6 |
| Maumee: | 38.2 |
| Rossford: | 41.5 |
| Northwood: | 84.3 |
| Fostoria: | 62.5 |
| Toledo: | 41.6 |
| Oregon: | 15.7 |
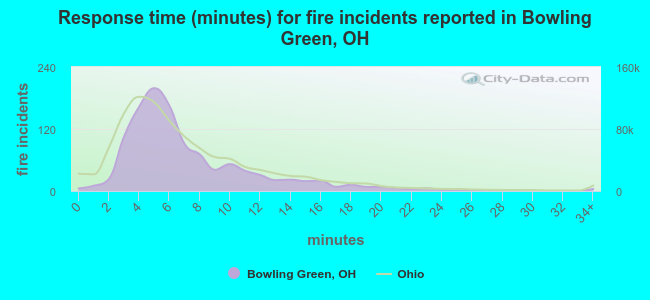 The median response time based on all reported fire incidents is 6 minutes. This is about the same as the state median value.
The median response time in Bowling Green, OH compared to nearest cities:
(Note: Based on data for all years, including only cities with at least 500 fire incidents)
| Bowling Green: | 6 minutes |
| Perrysburg: | 7 minutes |
| Maumee: | 5 minutes |
| Rossford: | 6 minutes |
| Holland: | 7 minutes |
| Northwood: | 7 minutes |
| Fostoria: | 4 minutes |
| Swanton: | 9 minutes |
| Toledo: | 4 minutes |
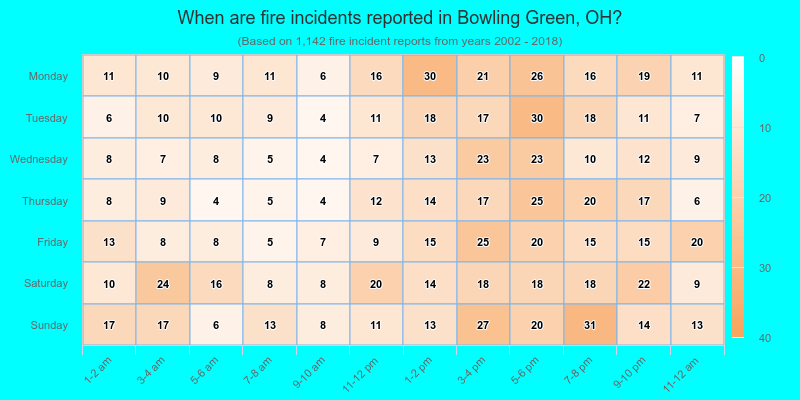
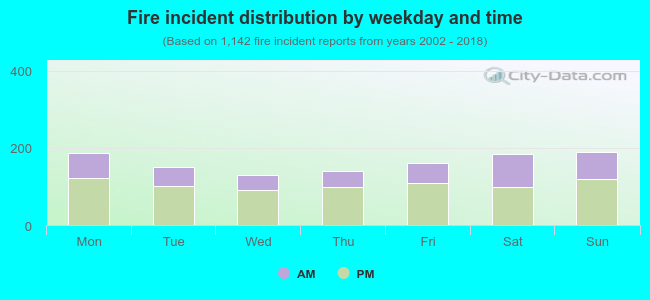 35.2% incidents where reported in the morning and 64.8% in the evening. The most fires (16.6%) took place on Sunday, and the least (11.3%) on Wednesday.
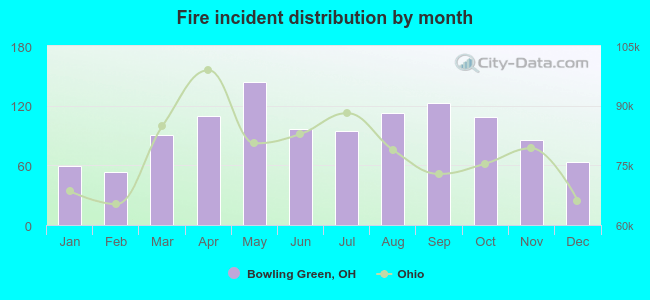 Based on the 1,142 fire incident reports from years 2002 - 2018 most fires (12.6%) took place during May, and the least (4.6%) in February.
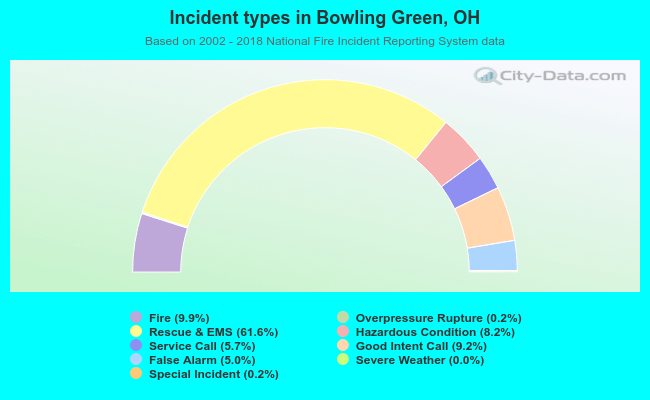 Out of all 11,591 cases reported during the years 2002 - 2018, the most belonged to the categories: Rescue & EMS (61.6%), Fire (9.9%), and Good Intent Call (9.2%).
 When looking into fire subcategories, the most reports belonged to: Outside Fires (45.4%), and Structure Fires (38.3%).