Bowling Green: Fire Incidents, Florida (FL)
Where are fire incidents reported in Bowling Green, FL
Something went wrong! Please refresh the page.
|
| |||||||||||||||||||||||||||||||||||||||||||||||||||||||||||||||||||||||||||||||||||||||||||||||||||||||||||||
2003 - 2018 National Fire Incident Reporting System (NFIRS) incidents
- Incident types reported to NFIRS in Bowling Green, FL
- 1,26756.1%Rescue & EMS
- 45019.9%Fire
- 27412.1%Good Intent Call
- 1034.6%Hazardous Condition
- 863.8%Service Call
- 743.3%False Alarm
- Fire incident types reported to NFIRS in Bowling Green, FL
- 33173.6%Outside Fires
- 6414.2%Structure Fires
- 4510.0%Mobile Property/Vehicle Fires
- 102.2%Other
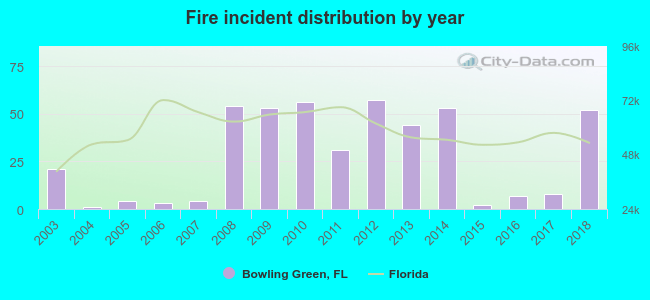 According to the data from the years 2003 - 2018 the average number of fire incidents per year is 28. The highest number of reported fire incidents - 57 took place in 2012, and the least - 1 in 2004. The data has an increasing trend.
 22.9% incidents where reported in the morning and 77.1% in the evening. The most fires (17.1%) took place on Monday, and the least (12.4%) on Tuesday.
 According to the 450 reports from years 2003 - 2018 most fires (13.1%) took place during March, and the least (4.7%) in October.
 Out of all 2,257 cases reported during the years 2003 - 2018, the most belonged to the categories: Rescue & EMS (56.1%), Fire (19.9%), and Good Intent Call (12.1%).
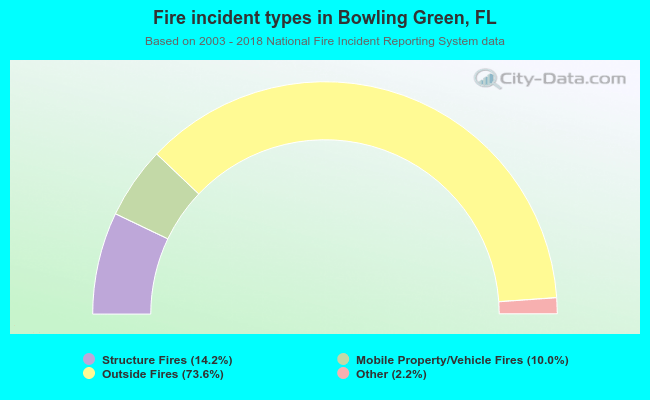 When looking into fire subcategories, the most reports belonged to: Outside Fires (73.6%), and Structure Fires (14.2%).