Bowersville: Fire Incidents, Ohio (OH)
Where are fire incidents reported in Bowersville, OH
Something went wrong! Please refresh the page.
|
| |||||||||||||||||||||||||||||||||||||||||||||||||||||||||||||||||||||||||||||||||||||||||
2002 - 2018 National Fire Incident Reporting System (NFIRS) incidents
- Incident types reported to NFIRS in Bowersville, OH
- 12239.2%Rescue & EMS
- 10634.1%Fire
- 309.6%Hazardous Condition
- 237.4%Service Call
- 227.1%Good Intent Call
- 51.6%False Alarm
- 20.6%Severe Weather
- 10.3%Special Incident
- Fire incident types reported to NFIRS in Bowersville, OH
- 5854.7%Structure Fires
- 3432.1%Outside Fires
- 1413.2%Mobile Property/Vehicle Fires
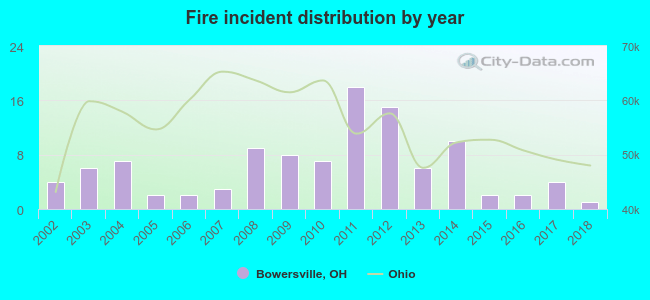 Based on the data from the years 2002 - 2018 the average number of fires per year is 6. The highest number of reported fire incidents - 18 took place in 2011, and the least - 1 in 2018. The data has a dropping trend.
 33.0% incidents where reported in the morning and 67.0% in the evening. The most fires (19.8%) took place on Tuesday, and the least (4.7%) on Wednesday.
 Based on the 106 fire incidents from years 2002 - 2018 most fires (14.2%) took place during February, and the least (2.8%) in January.
 Out of all 311 cases reported during the years 2002 - 2018, the most belonged to the categories: Overpressure Rupture (39.2%), Fire (34.1%), and Rescue & EMS (9.6%).
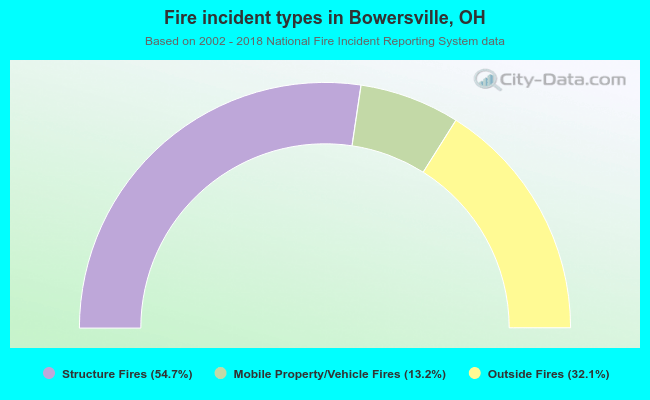 When looking into fire subcategories, the most incidents belonged to: Structure Fires (54.7%), and Outside Fires (32.1%).