| Fire incidents reported |
|---|
| Sreet name | Count |
|---|
| MAIN ST | 18 | | MAIN ST | 16 | | JUNIATA ST | 14 | | QUEMAHONING ST | 12 | | SOMERSET PIKE | 12 | | ALLEGHENY ST | 10 | | GREEN BRIDGE RD | 10 | | OHIO ST | 10 | | SOMERSET PIKE | 10 | | BLACKS HILL RD | 8 | | BLACKS HILL RD | 8 | | LAUREL SUMMIT RD | 8 | | LINCOLN HWY | 8 | | QUEMAHONING ST | 8 | | BARNETT RD | 6 | | BARNICK RD | 6 | | BOSWELL HTS | 6 | | CENTER ST | 6 | | CENTER ST | 6 | | CESSNA HILL RD | 6 | | HILLSIDE DR | 6 | | KAUFMAN RD | 6 | | OHIO ST | 6 | | PENN AV | 6 | | PENN AVE | 6 |
| | | Fire incidents reported |
|---|
| Sreet name | Count |
|---|
| ROUTE 219 NORTH BOUND | 6 | | STONEYCREEK ST | 6 | | STONYCREEK ST | 6 | | AJ LN | 4 | | ALLEGHENY ST | 4 | | ALWINE RD | 4 | | DRIFT RD | 4 | | GOLF COURSE RD | 4 | | GREENBRIDGE ROAD | 4 | | HAINES RD | 4 | | HEMLOCK RD | 4 | | KEYERSTOWN RD | 4 | | KEYSER RD | 4 | | KIRCHER PL | 4 | | LINCON HWY.(RT.#30) HWY | 4 | | MAIN STREET | 4 | | NERI RD | 4 | | OHIO ST. ST | 4 | | PENN AVE. (SOUTH) HWY | 4 | | PILLTOWN RD | 4 | | PINE SPRINGS CAMP RD | 4 | | QUEMAHONING ST ST | 4 | | ROLLING HILL RD | 4 | | ROSE RD | 4 | | |
|
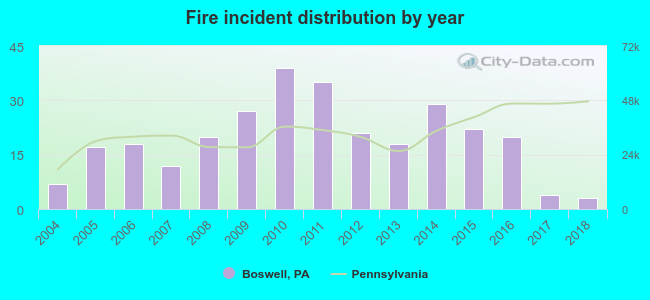 Based on the data from the years 2004 - 2018 the average number of fire incidents per year is 19. The highest number of reported fire incidents - 39 took place in 2010, and the least - 3 in 2018. The data has a decreasing trend.
 43.8% incidents where reported in the morning and 56.2% in the evening. The most fires (17.5%) took place on Thursday, and the least (13.0%) on Wednesday.
 According to the 292 incident reports from years 2004 - 2018 most fires (13.7%) took place during March, and the least (2.7%) in September.
 Out of all 418 cases reported during the years 2004 - 2018, the most belonged to the categories: Fire (69.9%), Rescue & EMS (8.1%), and Service Call (7.2%).
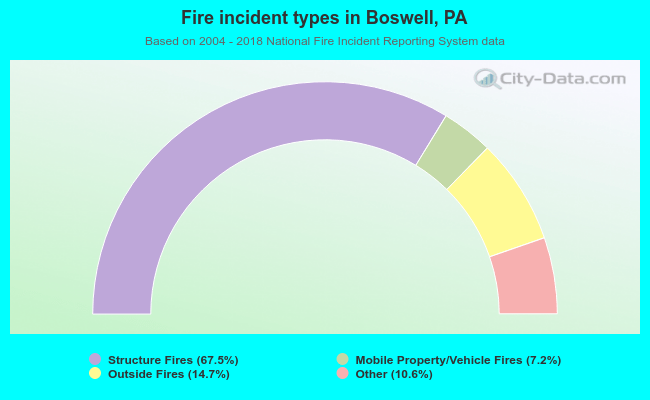 When looking into fire subcategories, the most incidents belonged to: Structure Fires (67.5%), and Outside Fires (14.7%).