Bonnie: Fire Incidents, Illinois (IL)
Where are fire incidents reported in Bonnie, IL
Something went wrong! Please refresh the page.
|
| |||||||||||||||||||||||||||||||||||||||||||||||||||||||||||||||||||||||||||||||||||||||||||||||||||||||||||||
2002 - 2018 National Fire Incident Reporting System (NFIRS) incidents
- Incident types reported to NFIRS in Bonnie, IL
- 23955.2%Rescue & EMS
- 12729.3%Fire
- 4610.6%Good Intent Call
- 143.2%Hazardous Condition
- 51.2%False Alarm
- 20.5%Service Call
- Fire incident types reported to NFIRS in Bonnie, IL
- 5140.2%Outside Fires
- 4233.1%Structure Fires
- 3023.6%Mobile Property/Vehicle Fires
- 43.1%Other
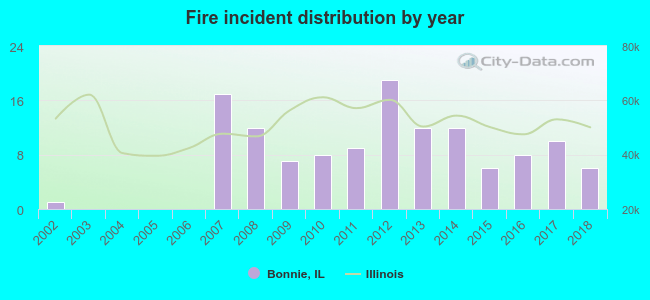 According to the data from the years 2002 - 2018 the average number of fire incidents per year is 7. The highest number of fire incidents - 19 took place in 2012, and the least - 0 in 2003. The data has an increasing trend.
 According to the reports from the years 2002 - 2018 the average number of fire-related yearly casualties is 0. The highest number of reported casualties - 3 took place in 2008, and the lowest - 0 in 2002. The data has a constant trend.
 34.6% incidents where reported in the morning and 65.4% in the evening. The most fires (20.5%) took place on Friday, and the least (8.7%) on Monday.
 According to the 127 fire incidents from years 2002 - 2018 most fires (13.4%) took place during February, and the least (2.4%) in September.
 Out of all 433 cases reported during the years 2002 - 2018, the most belonged to the categories: Overpressure Rupture (55.2%), Fire (29.3%), and Service Call (10.6%).
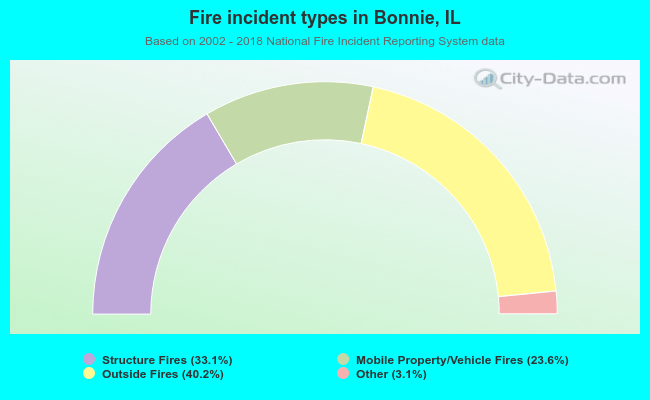 When looking into fire subcategories, the most reports belonged to: Outside Fires (40.2%), and Structure Fires (33.1%).