| Fire incidents reported |
|---|
| Sreet name | Count |
|---|
| BETHERA RD | 22 | | BLACK OAK RD | 18 | | NORTH HWY 17-A HWY | 18 | | NORTH HWY 17A HWY | 16 | | MAIL ROUTE RD | 14 | | BETSY HOLE RD | 12 | | BLACK OAK RD | 12 | | HARRISTOWN RD | 12 | | LONG ACRE DR | 12 | | ALBACORE RD | 10 | | CANE GULLY RD | 10 | | GENERAL MOULTRIE DR | 8 | | HILDEBRAND DR | 8 | | HOODTOWN RD | 8 | | SPRING GROVE RD | 8 | | WITHERBEE RD | 8 | | 1074 MERRIL AVE | 6 | | ALBACORE ROAD | 6 | | BARNYARD RD | 6 | | BEAVER DAM RD | 6 | | BLUE FLAME RD | 6 | | BLUE FLAME ROAD | 6 | | HIGHWAY 52 | 6 | | MERELL AVE | 6 | | OLD HORSESHOE ROAD | 6 |
| | | Fire incidents reported |
|---|
| Sreet name | Count |
|---|
| POOSHEE PLANTATION WAY | 6 | | TUXBURY LN | 6 | | UNITY RD | 6 | | 108 RICHARDSON STREET | 4 | | 116 ABNEY BAY COURT | 4 | | 125 CIRRUS LANE | 4 | | 125 POT HOLE LN | 4 | | 1253 SPRING GROVE RD | 4 | | 135 GENERAL WASHINGTON BLVD | 4 | | ALBACORE RD | 4 | | ALTERNATIVE LN | 4 | | ANCHOR LANE | 4 | | BARN RD | 4 | | BEATHEA RD | 4 | | BERTHERA RD | 4 | | BETHERA ROAD | 4 | | BRAD LN | 4 | | CHURCH ST | 4 | | DAWSEY DR | 4 | | DENNIS RIDGE RD | 4 | | DENNISE RIDGE RD | 4 | | DEWITT RD | 4 | | EAST CHURCH ST | 4 | | EAST CHURCH STREET | 4 | | EDITH LN | 4 |
|
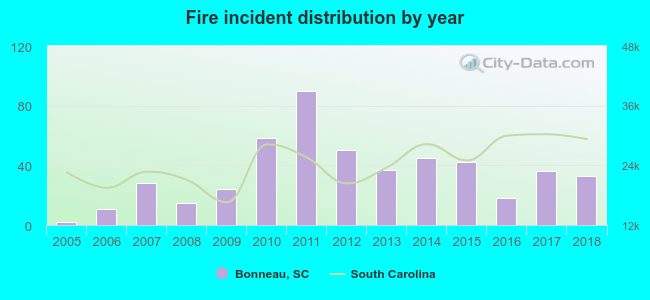 According to the data from the years 2005 - 2018 the average number of fires per year is 35. The highest number of reported fires - 90 took place in 2011, and the least - 2 in 2005. The data has an increasing trend.
 29.2% incidents where reported in the morning and 70.8% in the evening. The most fires (19.4%) took place on Monday, and the least (12.0%) on Tuesday.
 Based on the 490 incident reports from years 2005 - 2018 most fires (16.5%) took place during March, and the least (4.9%) in August.
 Out of all 1,452 cases reported during the years 2005 - 2018, the most belonged to the categories: Overpressure Rupture (54.3%), Fire (33.7%), and Service Call (4.8%).
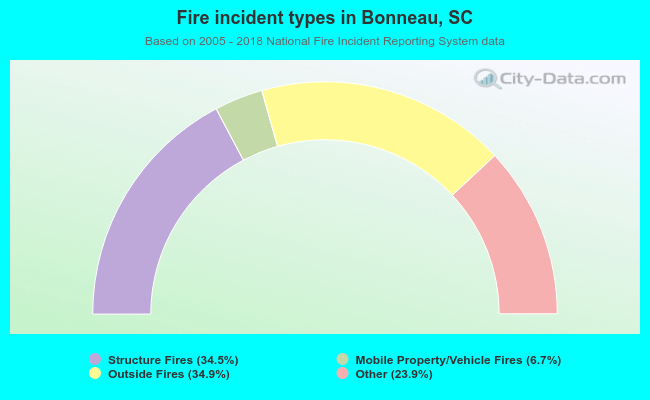 When looking into fire subcategories, the most incidents belonged to: Outside Fires (34.9%), and Structure Fires (34.5%).