Bonfield: Fire Incidents, Illinois (IL)
Where are fire incidents reported in Bonfield, IL
Something went wrong! Please refresh the page.
|
| |||||||||||||||||||||||||||||||||||||||||||||||||||||||||||||||||||||||||||||||||||||||||||||||||||||||||||||
2002 - 2018 National Fire Incident Reporting System (NFIRS) incidents
- Incident types reported to NFIRS in Bonfield, IL
- 31340.0%Rescue & EMS
- 26033.2%Fire
- 769.7%Hazardous Condition
- 749.5%Good Intent Call
- 374.7%Service Call
- 172.2%False Alarm
- 40.5%Special Incident
- 10.1%Overpressure Rupture
- Fire incident types reported to NFIRS in Bonfield, IL
- 11544.2%Structure Fires
- 11343.5%Outside Fires
- 238.8%Mobile Property/Vehicle Fires
- 93.5%Other
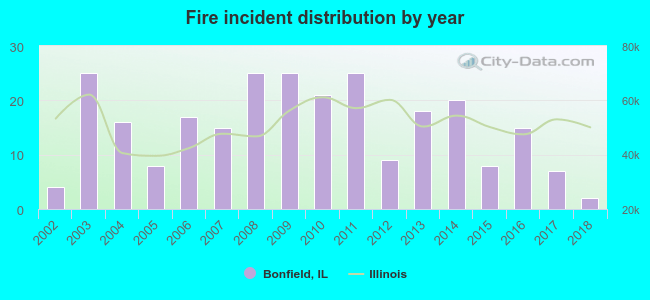 According to the data from the years 2002 - 2018 the average number of fire incidents per year is 15. The highest number of fire incidents - 25 took place in 2003, and the least - 2 in 2018. The data has a decreasing trend.
 26.5% incidents where reported in the morning and 73.5% in the evening. The most fires (20.8%) took place on Sunday, and the least (9.6%) on Thursday.
 According to the 260 incident reports from years 2002 - 2018 most fires (17.3%) took place during March, and the least (1.5%) in July.
 Out of all 782 cases reported during the years 2002 - 2018, the most belonged to the categories: Rescue & EMS (40.0%), Fire (33.2%), and Hazardous Condition (9.7%).
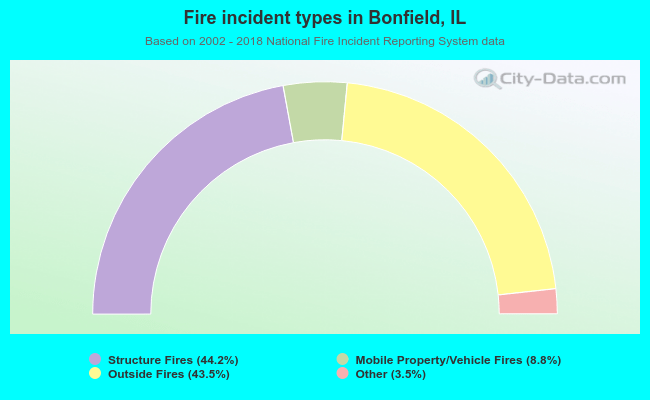 When looking into fire subcategories, the most reports belonged to: Structure Fires (44.2%), and Outside Fires (43.5%).