| Fire incidents reported |
|---|
| Sreet name | Count |
|---|
| KERNS DR | 32 | | NORTH ORCHARD RD | 26 | | I-77 | 20 | | FORT LAURENS RD | 18 | | SR 212 | 16 | | STRASBURG BOLIVAR RD | 16 | | EBERHART RD | 14 | | TOWPATH RD | 14 | | WELTON RD | 14 | | CANAL ST | 12 | | SHERMAN CHURCH RD | 12 | | STATE ROUTE 212 | 12 | | WATER ST | 12 | | FAIRVIEW ST | 10 | | INTERSTATE 77 | 10 | | NORTH ORCHARD | 10 | | FORT LAURENS ROAD | 8 | | FRENCH HILL RD | 8 | | MIDDLE RUN RD | 8 | | STRASBURGBOLIVAR RD | 8 | | BAKER DR | 6 | | BIMELER ST | 6 | | CANAL ROAD | 6 | | DOVER ZOAR RD | 6 | | FT. LAURENS RD | 6 |
| | | Fire incidents reported |
|---|
| Sreet name | Count |
|---|
| I77 | 6 | | KATHRYN SQ | 6 | | POPLAR ST | 6 | | STATE ROTUE 212 | 6 | | STRASBURG-BOLIVAR RD | 6 | | CANAL RD | 4 | | CANAL STREET | 4 | | DOVERZOAR RD | 4 | | EBERHART | 4 | | FRENCH HILL ROAD NW | 4 | | GLENPARK RD | 4 | | HESS MILL RD | 4 | | INDIAN HILLS DR | 4 | | INTERSTATE 77SB | 4 | | LAURENS DR | 4 | | NORTH ORCHARD ROAD | 4 | | OLDE ORCHARD DR | 4 | | ORCHARD RD | 4 | | RIVERDALE ST | 4 | | STATE ROUTE 212 NW | 4 | | STRASBURG BOLIVAR ROAD | 4 | | STRASBURGBOLIVAR ROAD | 4 | | WALNUT RIDGE ST | 4 | | WEST STREET | 4 | | |
|
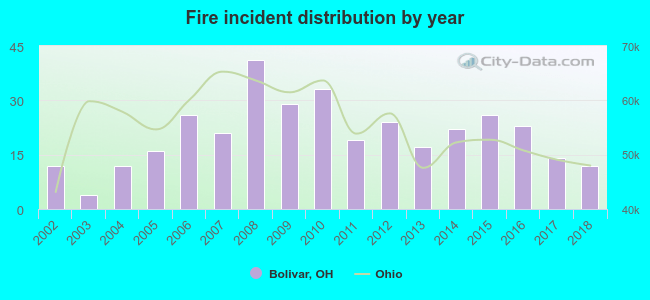 According to the data from the years 2002 - 2018 the average number of fires per year is 21. The highest number of fires - 41 took place in 2008, and the least - 4 in 2003. The data has a constant trend.
 32.8% incidents where reported in the morning and 67.2% in the evening. The most fires (19.9%) took place on Sunday, and the least (11.4%) on Thursday.
 Based on the 351 reports from years 2002 - 2018 most fires (16.8%) took place during April, and the least (3.1%) in August.
 Out of all 1,600 cases reported during the years 2002 - 2018, the most belonged to the categories: Rescue & EMS (47.5%), Fire (21.9%), and Service Call (9.9%).
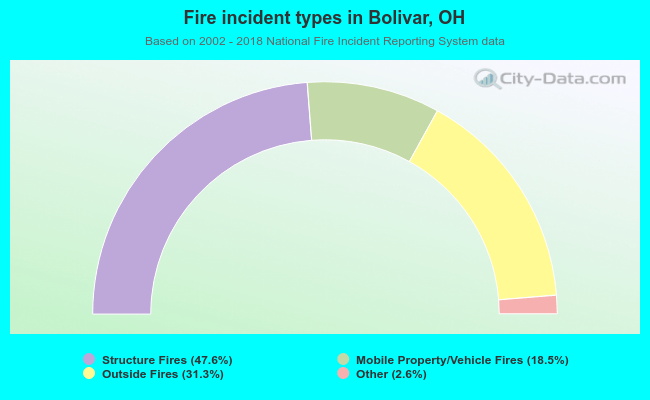 When looking into fire subcategories, the most reports belonged to: Structure Fires (47.6%), and Outside Fires (31.3%).