Boiling Springs: Fire Incidents, Pennsylvania (PA)
Where are fire incidents reported in Boiling Springs, PA
Something went wrong! Please refresh the page.
|
| |||||||||||||||||||||||||||||||||||||||||||||||||||||||||||||||||||||||||||||||||||||||||||||||||||||||||||||
2004 - 2017 National Fire Incident Reporting System (NFIRS) incidents
- Incident types reported to NFIRS in Boiling Springs, PA
- 20049.6%Fire
- 8721.6%Hazardous Condition
- 4711.7%Rescue & EMS
- 286.9%Service Call
- 276.7%Good Intent Call
- 82.0%False Alarm
- 41.0%Severe Weather
- 20.5%Special Incident
- Fire incident types reported to NFIRS in Boiling Springs, PA
- 14170.5%Structure Fires
- 4321.5%Outside Fires
- 84.0%Mobile Property/Vehicle Fires
- 84.0%Other
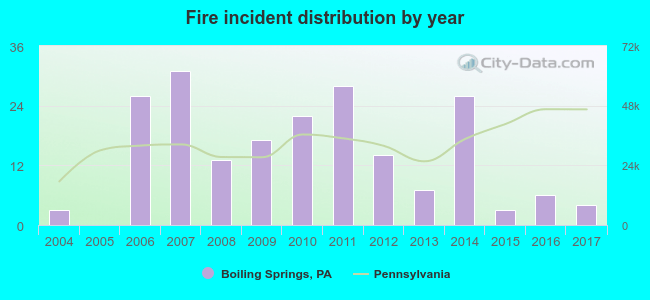 Based on the data from the years 2004 - 2017 the average number of fire incidents per year is 14. The highest number of reported fire incidents - 31 took place in 2007, and the least - 0 in 2005. The data has an increasing trend.
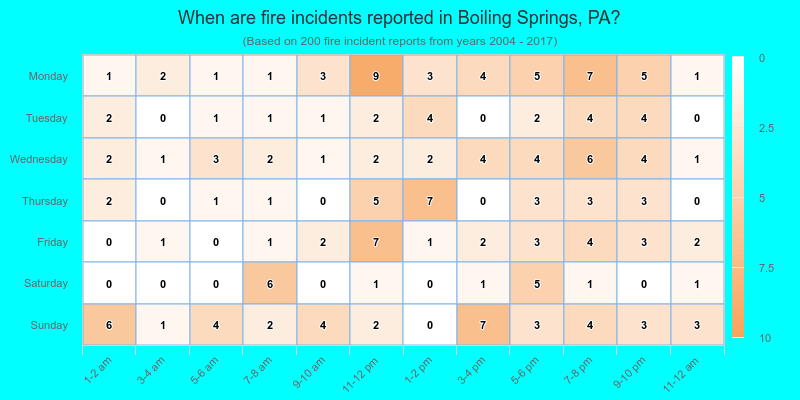
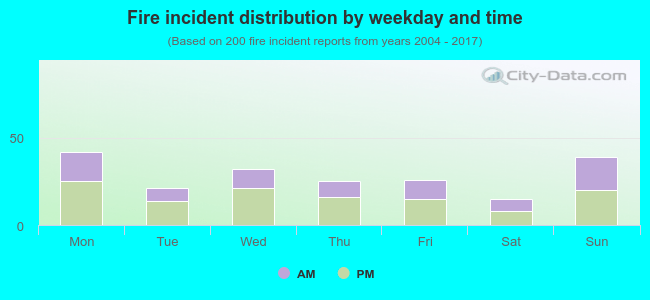 40.5% incidents where reported in the morning and 59.5% in the evening. The most fires (21.0%) took place on Monday, and the least (7.5%) on Saturday.
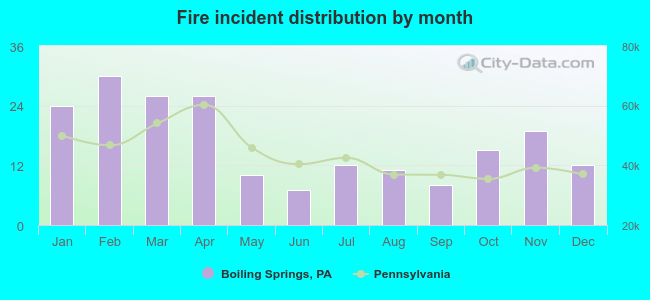 According to the 200 incident reports from years 2004 - 2017 most fires (15.0%) took place during February, and the least (3.5%) in June.
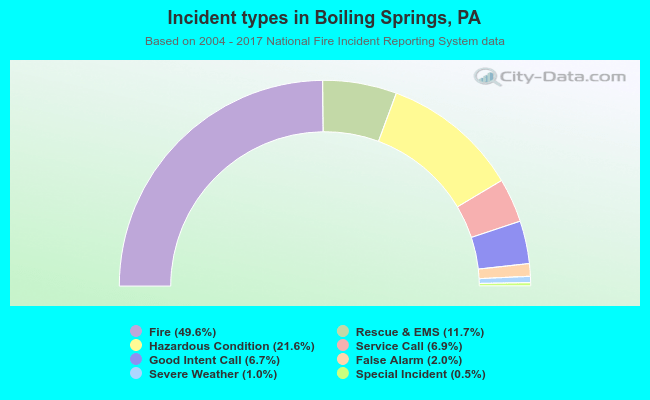 Out of all 403 cases reported during the years 2004 - 2017, the most belonged to the categories: Fire (49.6%), Rescue & EMS (21.6%), and Overpressure Rupture (11.7%).
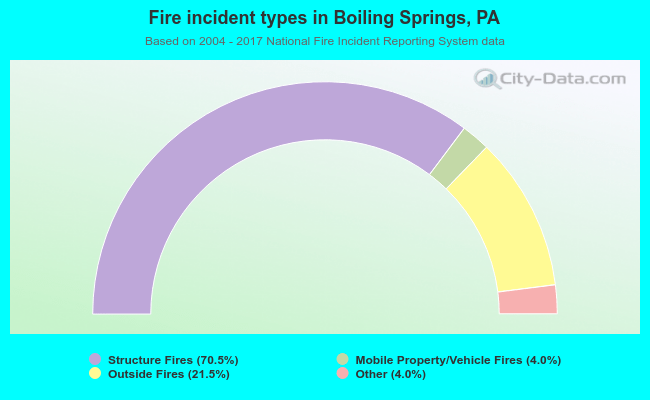 When looking into fire subcategories, the most incidents belonged to: Structure Fires (70.5%), and Outside Fires (21.5%).