Boalsburg: Fire Incidents, Pennsylvania (PA)
Where are fire incidents reported in Boalsburg, PA
Something went wrong! Please refresh the page.
|
| |||||||||||||||||||||||||||||||||||||||||||||||||||||||||||||||||||||||||||||||||||||||||||||||||||||||||||||
2004 - 2018 National Fire Incident Reporting System (NFIRS) incidents
- Incident types reported to NFIRS in Boalsburg, PA
- 10464.6%Fire
- 2213.7%Hazardous Condition
- 159.3%Service Call
- 148.7%Good Intent Call
- 31.9%Rescue & EMS
- 10.6%Overpressure Rupture
- 10.6%Severe Weather
- 10.6%Special Incident
- Fire incident types reported to NFIRS in Boalsburg, PA
- 5351.0%Structure Fires
- 3432.7%Outside Fires
- 109.6%Mobile Property/Vehicle Fires
- 76.7%Other
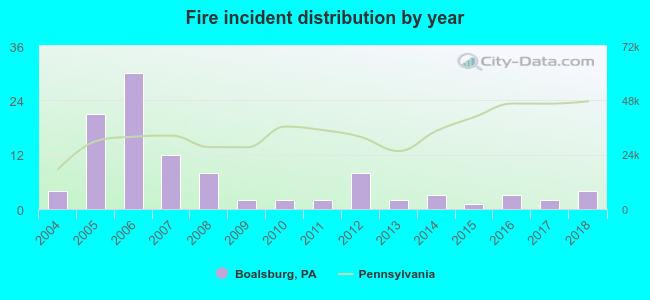 According to the data from the years 2004 - 2018 the average number of fires per year is 7. The highest number of reported fire incidents - 30 took place in 2006, and the least - 1 in 2015. The data has a constant trend.
 30.8% incidents where reported in the morning and 69.2% in the evening. The most fires (24.0%) took place on Monday, and the least (8.7%) on Thursday.
 Based on the 104 fire incident reports from years 2004 - 2018 most fires (16.3%) took place during April, and the least (3.8%) in July.
 Out of all 161 cases reported during the years 2004 - 2018, the most belonged to the categories: Fire (64.6%), Hazardous Condition (13.7%), and Service Call (9.3%).
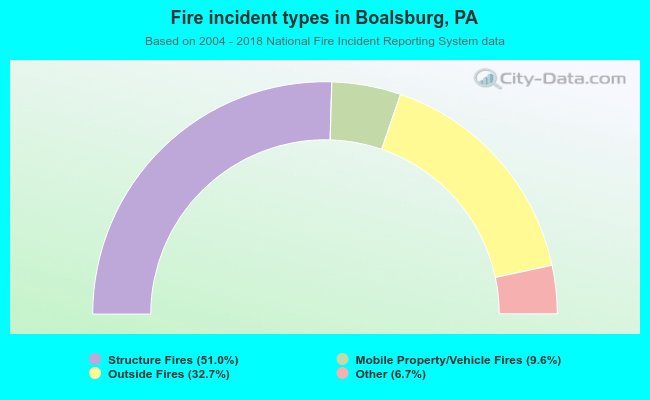 When looking into fire subcategories, the most reports belonged to: Structure Fires (51.0%), and Outside Fires (32.7%).