Blue Ball: Fire Incidents, Pennsylvania (PA)
Where are fire incidents reported in Blue Ball, PA
Something went wrong! Please refresh the page.
| Fire incidents reported | |
|---|---|
| Sreet name | Count |
| EARLAND DR | 4 |
| DIVISION HWY | 2 |
| EARLAND DR | 2 |
| RT 322 | 2 |
| Other | 184 |
2002 - 2015 National Fire Incident Reporting System (NFIRS) incidents
- Incident types reported to NFIRS in Blue Ball, PA
- 19464.2%Fire
- 6220.5%Hazardous Condition
- 144.6%Rescue & EMS
- 124.0%False Alarm
- 103.3%Good Intent Call
- 93.0%Service Call
- 10.3%Special Incident
- Fire incident types reported to NFIRS in Blue Ball, PA
- 14072.2%Structure Fires
- 4121.1%Outside Fires
- 115.7%Mobile Property/Vehicle Fires
- 21.0%Other
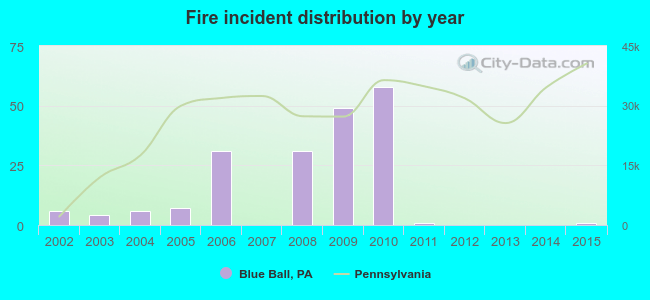 According to the data from the years 2002 - 2015 the average number of fires per year is 14. The highest number of reported fire incidents - 58 took place in 2010, and the least - 0 in 2007. The data has a declining trend.
 32.0% incidents where reported in the morning and 68.0% in the evening. The most fires (16.5%) took place on Tuesday, and the least (9.8%) on Sunday.
 Based on the 194 fire incidents from years 2002 - 2015 most fires (11.3%) took place during June, and the least (5.7%) in May.
 Out of all 302 cases reported during the years 2002 - 2015, the most belonged to the categories: Fire (64.2%), Rescue & EMS (20.5%), and Overpressure Rupture (4.6%).
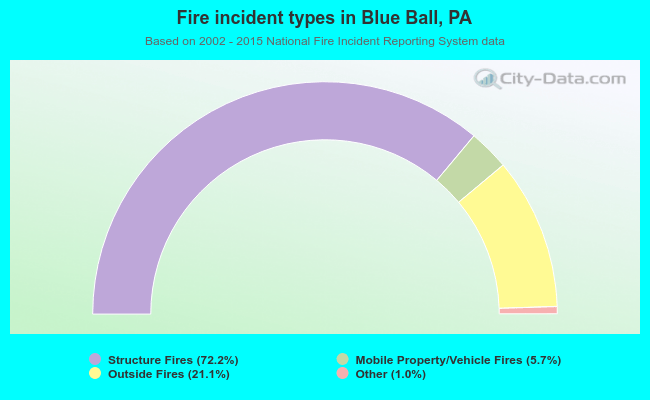 When looking into fire subcategories, the most incidents belonged to: Structure Fires (72.2%), and Outside Fires (21.1%).