Blountstown: Fire Incidents, Florida (FL)
Where are fire incidents reported in Blountstown, FL
Something went wrong! Please refresh the page.
|
| |||||||||||||||||||||||||||||||||||||||||||||||||||||||||||||||||||||||||||||||||||||||||||||||||||||||||||||
| Other | 269 | |||||||||||||||||||||||||||||||||||||||||||||||||||||||||||||||||||||||||||||||||||||||||||||||||||||||||||||
2003 - 2018 National Fire Incident Reporting System (NFIRS) incidents
- Incident types reported to NFIRS in Blountstown, FL
- 83234.8%Hazardous Condition
- 70129.3%Fire
- 56423.6%Rescue & EMS
- 2209.2%Service Call
- 331.4%False Alarm
- 281.2%Good Intent Call
- 150.6%Severe Weather
- Fire incident types reported to NFIRS in Blountstown, FL
- 34549.2%Outside Fires
- 22031.4%Structure Fires
- 8011.4%Mobile Property/Vehicle Fires
- 568.0%Other
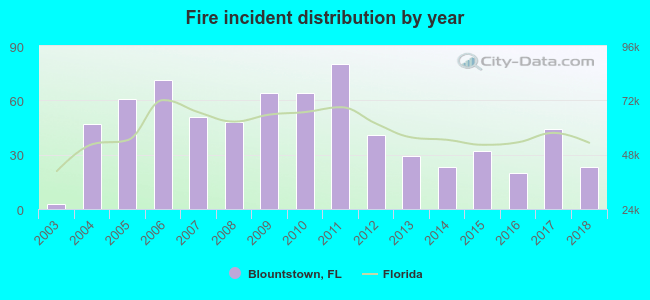 Based on the data from the years 2003 - 2018 the average number of fires per year is 44. The highest number of fire incidents - 80 took place in 2011, and the least - 3 in 2003. The data has an increasing trend.
 The median response time based on all reported fire incidents is 4 minutes. This is lower compared to the state median value.
The median response time in Blountstown, FL compared to nearest cities:
(Note: Based on data for all years, including only cities with at least 500 fire incidents)
| Blountstown: | 4 minutes |
| Marianna: | 7 minutes |
| Quincy: | 6 minutes |
| Cottondale: | 10 minutes |
| Midway: | 11 minutes |
| Chipley: | 10 minutes |
| Callaway: | 5 minutes |
| Lynn Haven: | 3 minutes |
| Springfield: | 4 minutes |
 29.2% incidents where reported in the morning and 70.8% in the evening. The most fires (17.4%) took place on Monday, and the least (12.8%) on Thursday.
 Based on the 701 fire incident reports from years 2003 - 2018 most fires (12.4%) took place during March, and the least (4.4%) in August.
 Out of all 2,394 cases reported during the years 2003 - 2018, the most belonged to the categories: Rescue & EMS (34.8%), Fire (29.3%), and Overpressure Rupture (23.6%).
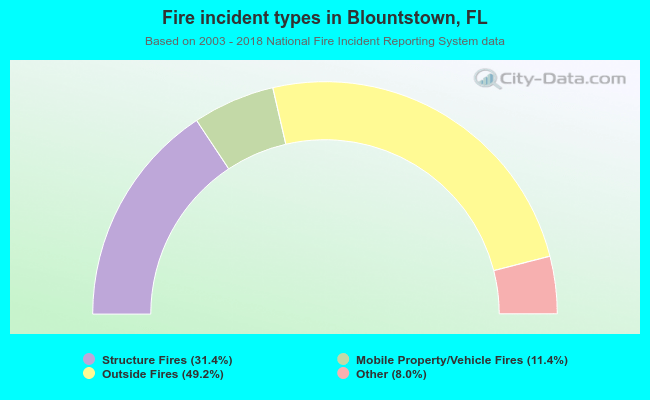 When looking into fire subcategories, the most incidents belonged to: Outside Fires (49.2%), and Structure Fires (31.4%).