| Fire incidents reported |
|---|
| Sreet name | Count |
|---|
| US 224 HWY | 16 | | NEW WASHINGTON RD. | 12 | | STATE ROUTE 19 HWY | 10 | | CO. RD. 49 RD | 8 | | CO RD 12 RD | 6 | | CO. RD. 43 | 6 | | MARION ST | 6 | | SR 4 HWY | 6 | | STATE ROUTE 67 HWY | 6 | | 10 LIBERTY ST. | 4 | | 16 CLINTON ST. | 4 | | 2831 S SR 19 | 4 | | 52 WEST NEWHAVEN | 4 | | CO. RD. 6 | 4 | | HIGH ST | 4 | | JEFFERSON ST | 4 | | NEW HAVEN | 4 | | NEW HAVEN ST | 4 | | NEW WASHINGTON RD | 4 | | ORR RD | 4 | | RAIL ROAD ST | 4 | | SENECA CRAWFORD LINE RD | 4 | | SR 19 HWY | 4 | | TWP RD 173 | 4 | | TWP. RD. 58 | 4 |
| | | Fire incidents reported |
|---|
| Sreet name | Count |
|---|
| US 224 | 4 | | US 4 | 4 | | 10'000 BLOCL OF TWP. RD. | 2 | | 106 COLLEDGE ST. | 2 | | 10926 COUNTY ROAD 12 | 2 | | 11 1/2 COLLEGE | 2 | | 16 EASTNEWHAVEN ST | 2 | | 19 EAST NEWHAVEN ST | 2 | | 19 NORTH HIGH ST | 2 | | 21 N. MARION ST. | 2 | | 21 SCOTT ST | 2 | | 21 SCOTT ST. | 2 | | 2300 S SR 19 | 2 | | 2503 S TR 77 | 2 | | 3 LOVERS LANE | 2 | | 30 E. NEW HAVEN ST. | 2 | | 3500 BLOCK OF S. ST. RT. | 2 | | 3561 S. ST. RT. 19 | 2 | | 4416 S TR 173 | 2 | | 45 S. MARION ST | 2 | | 4575 S CR 49 | 2 | | 4577 CO RD. 49 | 2 | | 4610 E. CO. RD. 16 | 2 | | 4610 TWP RD 173 | 2 | | |
|
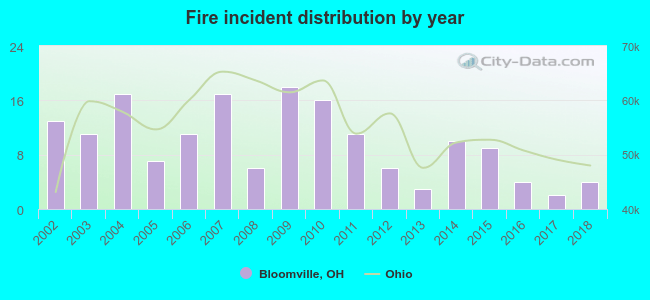 According to the data from the years 2002 - 2018 the average number of fires per year is 10. The highest number of reported fire incidents - 18 took place in 2009, and the least - 2 in 2017. The data has a declining trend.
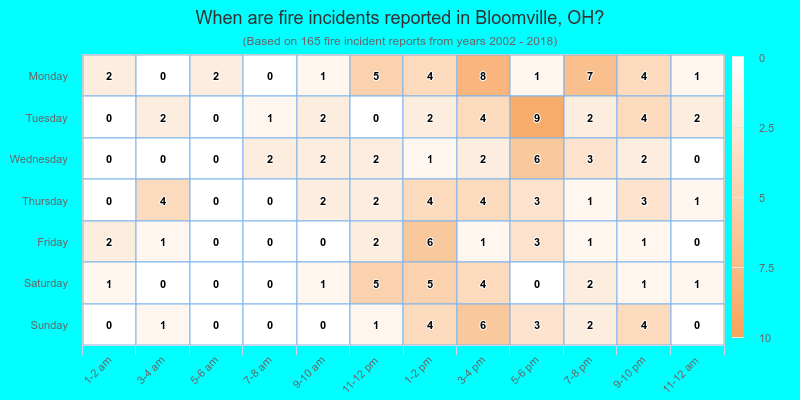
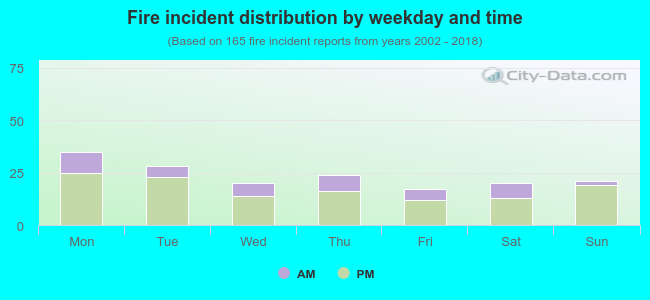 26.1% incidents where reported in the morning and 73.9% in the evening. The most fires (21.2%) took place on Monday, and the least (10.3%) on Friday.
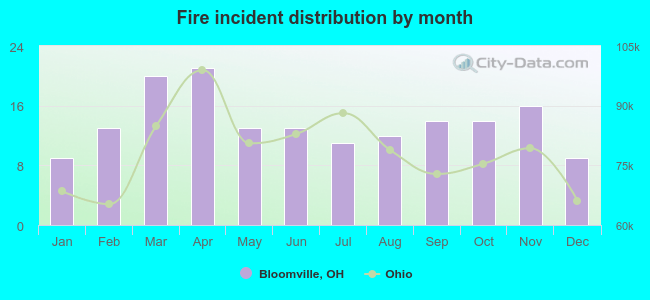 According to the 165 fires from years 2002 - 2018 most fires (12.7%) took place during April, and the least (5.5%) in January.
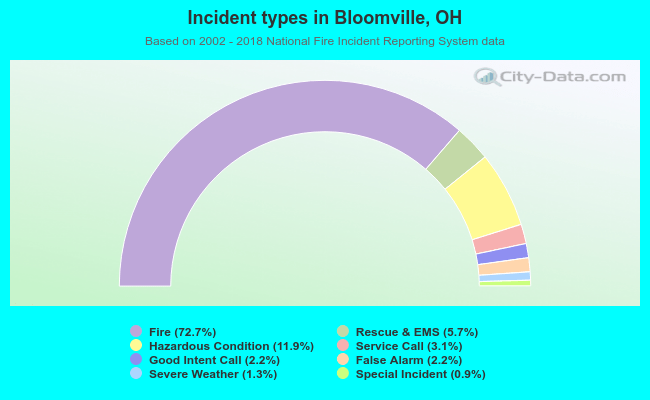 Out of all 227 cases reported during the years 2002 - 2018, the most belonged to the categories: Fire (72.7%), Rescue & EMS (11.9%), and Overpressure Rupture (5.7%).
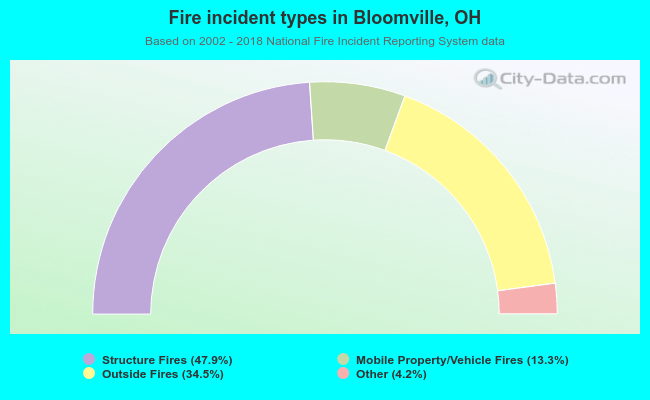 When looking into fire subcategories, the most incidents belonged to: Structure Fires (47.9%), and Outside Fires (34.5%).