Bloomingdale: Fire Incidents, Michigan (MI)
Where are fire incidents reported in Bloomingdale, MI
Something went wrong! Please refresh the page.
|
| |||||||||||||||||||||||||||||||||||||||||||||||||||||||||||||||||||||||||||||||||||||||||||||||||||||||||||||
| Other | 29 | |||||||||||||||||||||||||||||||||||||||||||||||||||||||||||||||||||||||||||||||||||||||||||||||||||||||||||||
2002 - 2018 National Fire Incident Reporting System (NFIRS) incidents
- Incident types reported to NFIRS in Bloomingdale, MI
- 23943.3%Fire
- 9617.4%Good Intent Call
- 9316.8%Hazardous Condition
- 8315.0%Rescue & EMS
- 264.7%False Alarm
- 132.4%Service Call
- 20.4%Special Incident
- Fire incident types reported to NFIRS in Bloomingdale, MI
- 14259.4%Structure Fires
- 6125.5%Outside Fires
- 239.6%Mobile Property/Vehicle Fires
- 135.4%Other
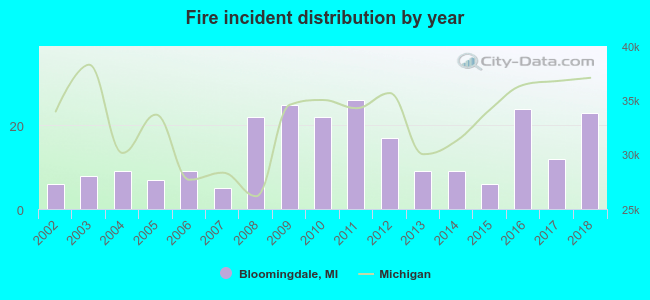 Based on the data from the years 2002 - 2018 the average number of fires per year is 14. The highest number of fires - 26 took place in 2011, and the least - 5 in 2007. The data has an increasing trend.
 27.6% incidents where reported in the morning and 72.4% in the evening. The most fires (18.0%) took place on Friday, and the least (7.5%) on Tuesday.
 According to the 239 reports from years 2002 - 2018 most fires (17.6%) took place during April, and the least (2.5%) in December.
 Out of all 552 cases reported during the years 2002 - 2018, the most belonged to the categories: Fire (43.3%), Service Call (17.4%), and Rescue & EMS (16.8%).
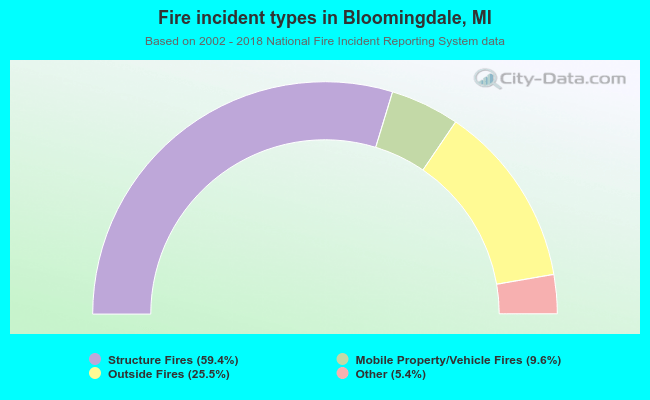 When looking into fire subcategories, the most reports belonged to: Structure Fires (59.4%), and Outside Fires (25.5%).