Bloomingburg: Fire Incidents, Ohio (OH)
Where are fire incidents reported in Bloomingburg, OH
Something went wrong! Please refresh the page.
|
| |||||||||||||||||||||||||||||||||||||||||||||||||||||||||||||||||||||||||||||||||||||||||||||||||||||||||||||
2002 - 2018 National Fire Incident Reporting System (NFIRS) incidents
- Incident types reported to NFIRS in Bloomingburg, OH
- 61350.5%Hazardous Condition
- 37931.2%Fire
- 1028.4%Service Call
- 544.5%Good Intent Call
- 262.1%Rescue & EMS
- 231.9%Severe Weather
- 131.1%False Alarm
- 20.2%Special Incident
- Fire incident types reported to NFIRS in Bloomingburg, OH
- 17145.1%Structure Fires
- 12633.2%Outside Fires
- 7920.8%Mobile Property/Vehicle Fires
- 30.8%Other
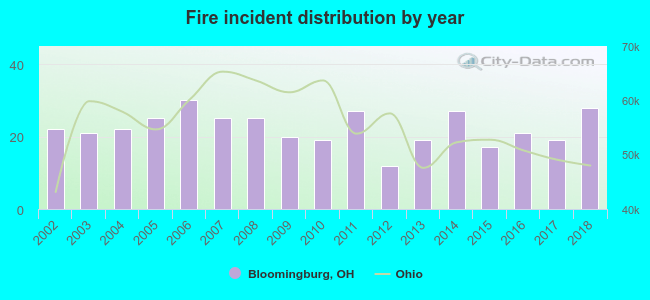 According to the data from the years 2002 - 2018 the average number of fires per year is 22. The highest number of reported fire incidents - 30 took place in 2006, and the least - 12 in 2012. The data has a rising trend.
 29.6% incidents where reported in the morning and 70.4% in the evening. The most fires (17.2%) took place on Wednesday, and the least (11.9%) on Thursday.
 According to the 379 fires from years 2002 - 2018 most fires (12.9%) took place during June, and the least (4.2%) in December.
 Out of all 1,213 cases reported during the years 2002 - 2018, the most belonged to the categories: Hazardous Condition (50.5%), Fire (31.2%), and Service Call (8.4%).
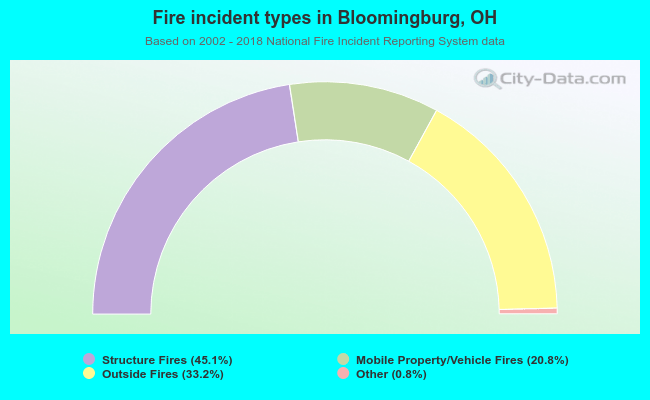 When looking into fire subcategories, the most incidents belonged to: Structure Fires (45.1%), and Outside Fires (33.2%).