Bloomer: Fire Incidents, Wisconsin (WI)
Where are fire incidents reported in Bloomer, WI
Something went wrong! Please refresh the page.
|
| |||||||||||||||||||||||||||||||||||||||||||||||||||||||||||||||||||||||||||||||||||||||||||||||||||||||||||||
2004 - 2018 National Fire Incident Reporting System (NFIRS) incidents
- Incident types reported to NFIRS in Bloomer, WI
- 35645.1%Fire
- 23730.0%Rescue & EMS
- 12315.6%Hazardous Condition
- 405.1%Good Intent Call
- 172.2%False Alarm
- 121.5%Service Call
- 30.4%Overpressure Rupture
- 10.1%Special Incident
- Fire incident types reported to NFIRS in Bloomer, WI
- 14841.6%Outside Fires
- 13838.8%Structure Fires
- 5415.2%Mobile Property/Vehicle Fires
- 164.5%Other
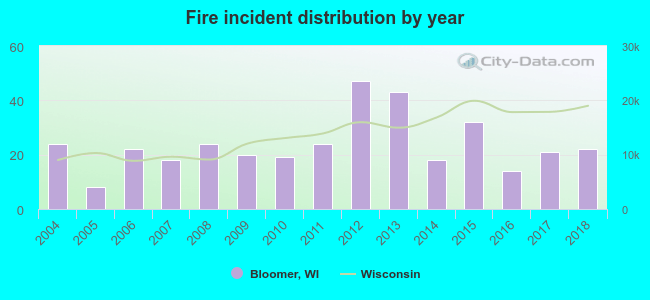 Based on the data from the years 2004 - 2018 the average number of fires per year is 24. The highest number of reported fire incidents - 47 took place in 2012, and the least - 8 in 2005. The data has a declining trend.
 29.5% incidents where reported in the morning and 70.5% in the evening. The most fires (18.3%) took place on Tuesday, and the least (10.1%) on Thursday.
 According to the 356 fire incident reports from years 2004 - 2018 most fires (14.3%) took place during April, and the least (3.7%) in February.
 Out of all 789 cases reported during the years 2004 - 2018, the most belonged to the categories: Fire (45.1%), Rescue & EMS (30.0%), and Hazardous Condition (15.6%).
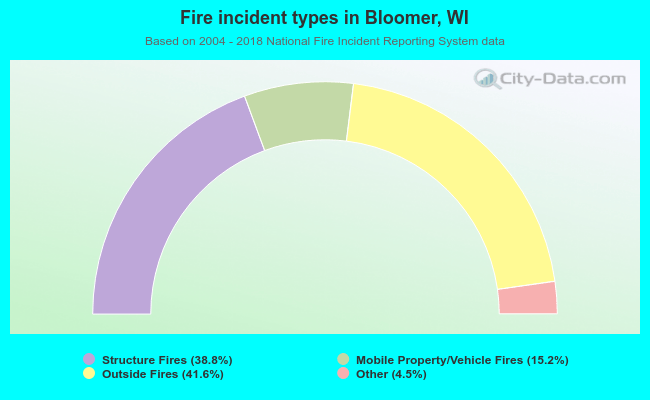 When looking into fire subcategories, the most reports belonged to: Outside Fires (41.6%), and Structure Fires (38.8%).