Blandinsville: Fire Incidents, Illinois (IL)
Where are fire incidents reported in Blandinsville, IL
Something went wrong! Please refresh the page.
|
| |||||||||||||||||||||||||||||||||||||||||||||||||||||||||||||||||||||||||||||||||||||||||||||||||||||||||||||
2002 - 2018 National Fire Incident Reporting System (NFIRS) incidents
- Incident types reported to NFIRS in Blandinsville, IL
- 16646.5%Rescue & EMS
- 12535.0%Fire
- 339.2%Hazardous Condition
- 215.9%Good Intent Call
- 51.4%False Alarm
- 30.8%Service Call
- 30.8%Severe Weather
- 10.3%Overpressure Rupture
- Fire incident types reported to NFIRS in Blandinsville, IL
- 4838.4%Outside Fires
- 3124.8%Structure Fires
- 2419.2%Other
- 2217.6%Mobile Property/Vehicle Fires
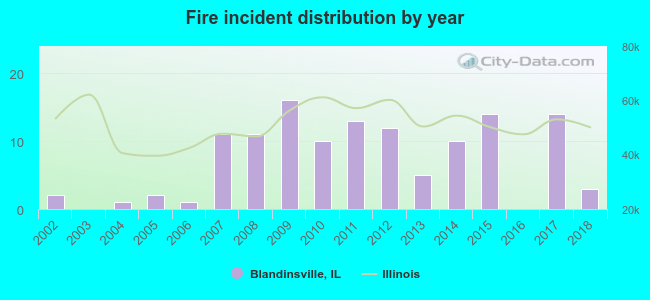 According to the data from the years 2002 - 2018 the average number of fire incidents per year is 7. The highest number of reported fires - 16 took place in 2009, and the least - 0 in 2003. The data has a rising trend.
 26.4% incidents where reported in the morning and 73.6% in the evening. The most fires (19.2%) took place on Wednesday, and the least (10.4%) on Sunday.
 According to the 125 incident reports from years 2002 - 2018 most fires (16.8%) took place during April, and the least (2.4%) in June.
 Out of all 357 cases reported during the years 2002 - 2018, the most belonged to the categories: Rescue & EMS (46.5%), Fire (35.0%), and Hazardous Condition (9.2%).
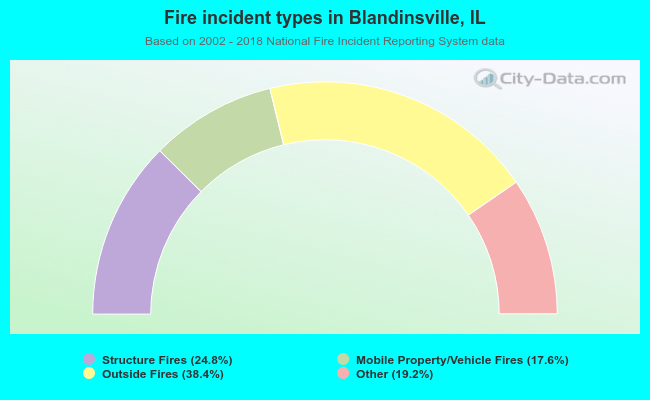 When looking into fire subcategories, the most incidents belonged to: Outside Fires (38.4%), and Structure Fires (24.8%).