Blairsville: Fire Incidents, Pennsylvania (PA)
Where are fire incidents reported in Blairsville, PA
Something went wrong! Please refresh the page.
|
| |||||||||||||||||||||||||||||||||||||||||||||||||||||||||||||||||||||||||||||||||||||||||||||||||||||||||||||
2005 - 2018 National Fire Incident Reporting System (NFIRS) incidents
- Incident types reported to NFIRS in Blairsville, PA
- 14433.6%Fire
- 7116.6%Rescue & EMS
- 6815.9%Service Call
- 5412.6%False Alarm
- 5312.4%Hazardous Condition
- 347.9%Good Intent Call
- 40.9%Special Incident
- Fire incident types reported to NFIRS in Blairsville, PA
- 10371.5%Structure Fires
- 2316.0%Outside Fires
- 117.6%Mobile Property/Vehicle Fires
- 74.9%Other
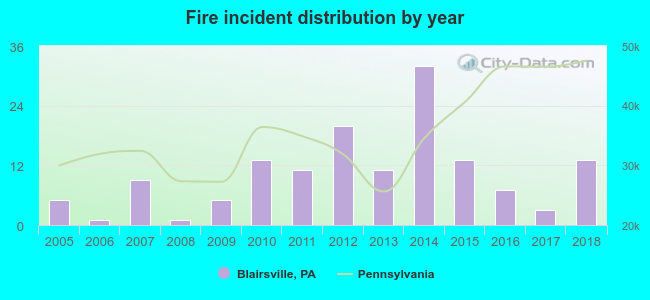 According to the data from the years 2005 - 2018 the average number of fires per year is 10. The highest number of reported fire incidents - 32 took place in 2014, and the least - 1 in 2006. The data has a rising trend.
 35.4% incidents where reported in the morning and 64.6% in the evening. The most fires (18.8%) took place on Sunday, and the least (10.4%) on Thursday.
 Based on the 144 fire incidents from years 2005 - 2018 most fires (16.0%) took place during February, and the least (3.5%) in December.
 Out of all 428 cases reported during the years 2005 - 2018, the most belonged to the categories: Fire (33.6%), Overpressure Rupture (16.6%), and Hazardous Condition (15.9%).
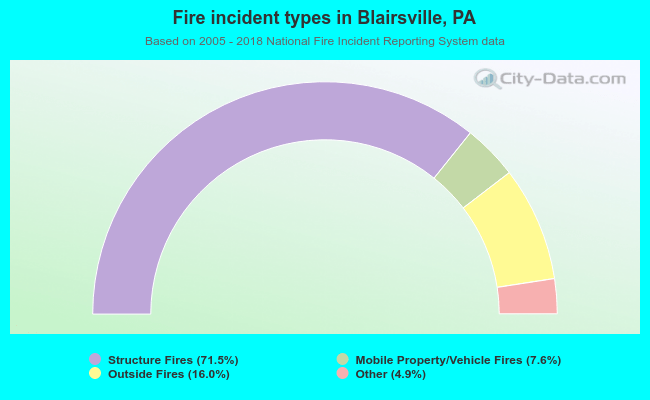 When looking into fire subcategories, the most incidents belonged to: Structure Fires (71.5%), and Outside Fires (16.0%).