Bishop: Fire Incidents, Texas (TX)
Where are fire incidents reported in Bishop, TX
Something went wrong! Please refresh the page.
|
| |||||||||||||||||||||||||||||||||||||||||||||||||||||||||||||||||||||||||||||||||||||||||||||||||||||||||||||
2002 - 2018 National Fire Incident Reporting System (NFIRS) incidents
- Incident types reported to NFIRS in Bishop, TX
- 19749.6%Fire
- 11629.2%Hazardous Condition
- 4110.3%Rescue & EMS
- 297.3%Good Intent Call
- 51.3%Service Call
- 51.3%False Alarm
- 30.8%Special Incident
- 10.3%Overpressure Rupture
- Fire incident types reported to NFIRS in Bishop, TX
- 12161.4%Outside Fires
- 4422.3%Structure Fires
- 3015.2%Mobile Property/Vehicle Fires
- 21.0%Other
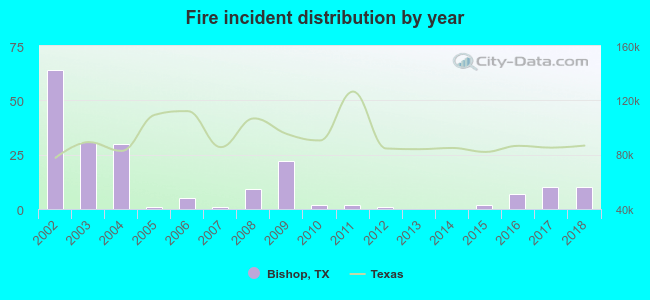 Based on the data from the years 2002 - 2018 the average number of fire incidents per year is 12. The highest number of reported fires - 64 took place in 2002, and the least - 0 in 2013. The data has a decreasing trend.
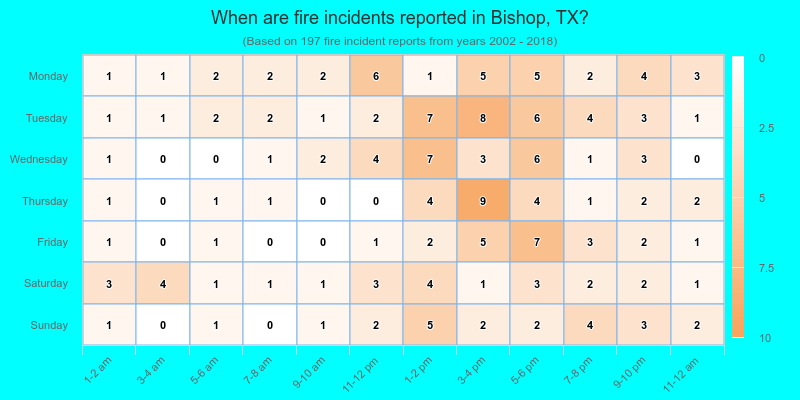
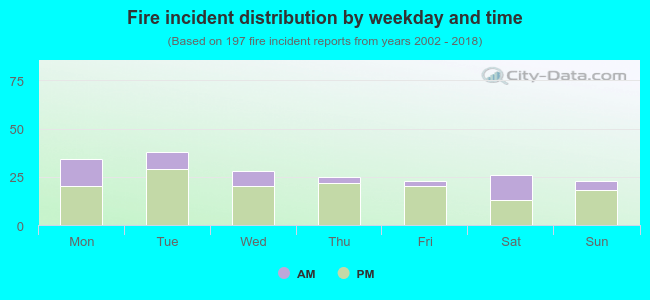 27.9% incidents where reported in the morning and 72.1% in the evening. The most fires (19.3%) took place on Tuesday, and the least (11.7%) on Friday.
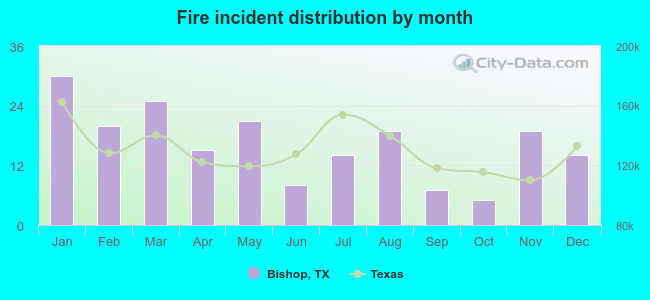 Based on the 197 fire incident reports from years 2002 - 2018 most fires (15.2%) took place during January, and the least (2.5%) in October.
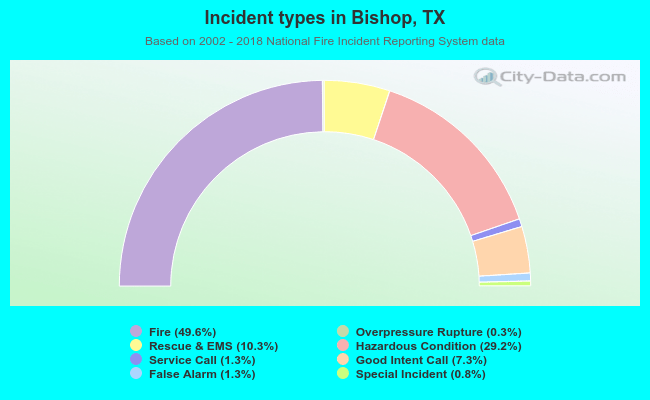 Out of all 397 cases reported during the years 2002 - 2018, the most belonged to the categories: Fire (49.6%), Hazardous Condition (29.2%), and Rescue & EMS (10.3%).
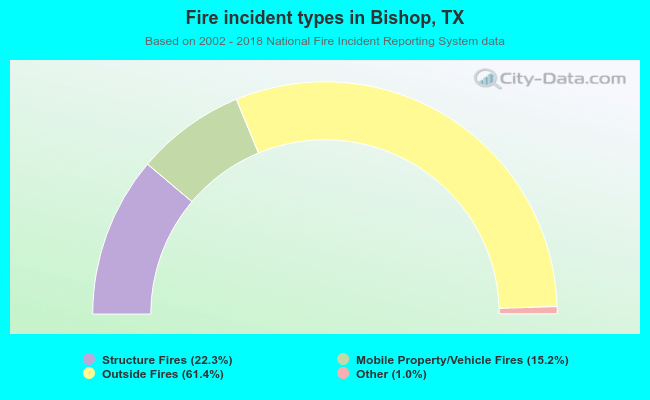 When looking into fire subcategories, the most incidents belonged to: Outside Fires (61.4%), and Structure Fires (22.3%).