| Fire incidents reported |
|---|
| Sreet name | Count |
|---|
| LICK CREEK RD | 16 | | BOAT DOCK2 RD | 14 | | HWY 69A | 14 | | 1117 HICKS RD | 6 | | 12873 HWY 69A | 6 | | 2125 LICK CREEK RD | 6 | | 500 LOWER BIG SANDY RD | 6 | | DANVILLE RD | 6 | | HILL CHAPEL RD | 6 | | NEW HOPE RD | 6 | | SULPHUR CREEK RD | 6 | | 104 OLD HOMESTEAD RD | 4 | | 125 LYNN LANE | 4 | | 13395 HWY 69A | 4 | | 1595 SULPHUR CREEK RD | 4 | | 20 BALL PARK RD | 4 | | 31 CATFISH LN | 4 | | 370 BAIN RD | 4 | | 3800 CEDAR GROVE RD | 4 | | 401 RASPBERRY RD | 4 | | 430 OAK ST | 4 | | 45 HEATHCOTT LANE | 4 | | 541 5TH STREET | 4 | | 545 OLD HOMESTEAD RD | 4 | | 5535 POINT MASON RD | 4 |
| | | Fire incidents reported |
|---|
| Sreet name | Count |
|---|
| 605 RIVER OAKS DR | 4 | | 650 POINT MASON RD | 4 | | 70 GARNER HOLLOW RD | 4 | | 7510 SULPHUR CREEK RD | 4 | | 885 SANDYS CAMP RD | 4 | | 9190 HWY 69A | 4 | | 990 NEW HOPE RD | 4 | | BALL PARK | 4 | | LITTLE SULPHUR CREEK RD | 4 | | PT MASON RD | 4 | | SANDYS CAMP RD | 4 | | 100 ADA RD | 2 | | 100 MT. ZION RD | 2 | | 101 BLUFF RD | 2 | | 1011 POINT MASON RD | 2 | | 10112 HWY 69A | 2 | | 10290 HWY 69A | 2 | | 10380 LICK CREEK RD | 2 | | 105 CLARK DR. | 2 | | 1050 PT. MASON RD. | 2 | | 10555 HWY 69A | 2 | | 110 SANDYS CAMP RD | 2 | | 1125 SULPHUR CREEK RD | 2 | | 11535 HWY 69A | 2 | | 11575 HWY 69A | 2 |
|
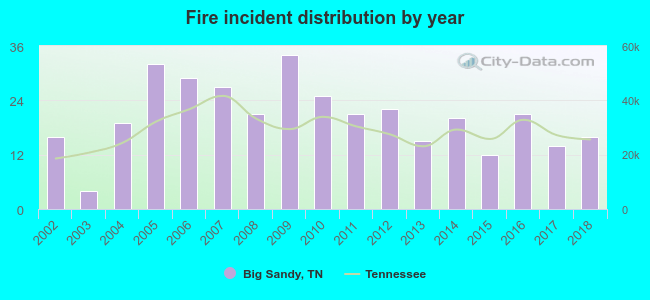 According to the data from the years 2002 - 2018 the average number of fire incidents per year is 20. The highest number of fires - 34 took place in 2009, and the least - 4 in 2003. The data has a constant trend.
 According to the reports from the years 2002 - 2018 the average number of fire-related yearly casualties is 0. The highest number of reported casualties - 2 took place in 2013, and the lowest - 0 in 2002. The data has a rising trend.
 29.9% incidents where reported in the morning and 70.1% in the evening. The most fires (16.7%) took place on Saturday, and the least (11.8%) on Wednesday.
 Based on the 348 reports from years 2002 - 2018 most fires (17.2%) took place during March, and the least (4.0%) in May.
 Out of all 510 cases reported during the years 2002 - 2018, the most belonged to the categories: Fire (68.2%), Overpressure Rupture (16.5%), and Service Call (8.2%).
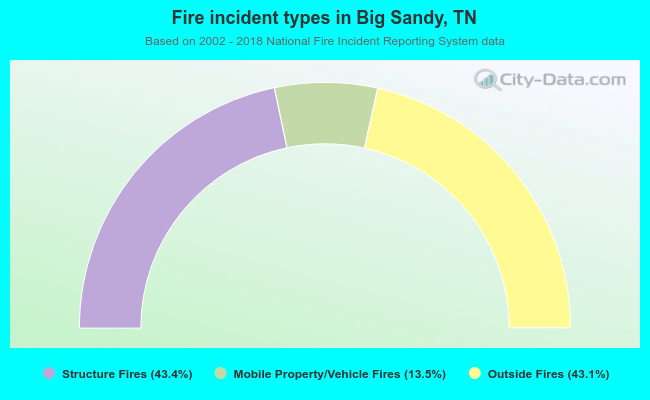 When looking into fire subcategories, the most incidents belonged to: Structure Fires (43.4%), and Outside Fires (43.1%).