Bienville: Fire Incidents, Louisiana (LA)
Where are fire incidents reported in Bienville, LA
Something went wrong! Please refresh the page.
|
| |||||||||||||||||||||||||||||||||||||||||||||||||||||||||||||||||||||||||||||||||||||||||
2003 - 2018 National Fire Incident Reporting System (NFIRS) incidents
- Incident types reported to NFIRS in Bienville, LA
- 13458.0%Fire
- 6628.6%Rescue & EMS
- 125.2%Hazardous Condition
- 83.5%Service Call
- 83.5%Good Intent Call
- 31.3%False Alarm
- Fire incident types reported to NFIRS in Bienville, LA
- 10175.4%Outside Fires
- 2115.7%Structure Fires
- 75.2%Mobile Property/Vehicle Fires
- 53.7%Other
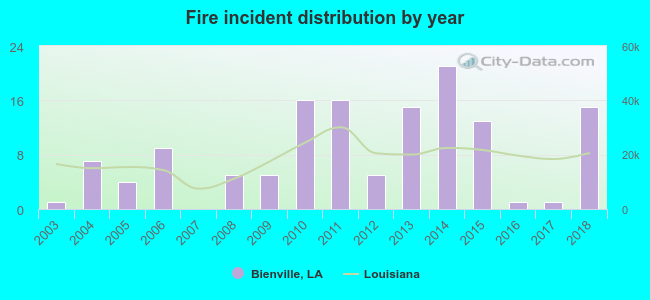 According to the data from the years 2003 - 2018 the average number of fires per year is 8. The highest number of reported fires - 21 took place in 2014, and the least - 0 in 2007. The data has a growing trend.
 26.9% incidents where reported in the morning and 73.1% in the evening. The most fires (20.9%) took place on Tuesday, and the least (8.2%) on Monday.
 According to the 134 incident reports from years 2003 - 2018 most fires (14.2%) took place during August, and the least (2.2%) in December.
 Out of all 231 cases reported during the years 2003 - 2018, the most belonged to the categories: Fire (58.0%), Overpressure Rupture (28.6%), and Rescue & EMS (5.2%).
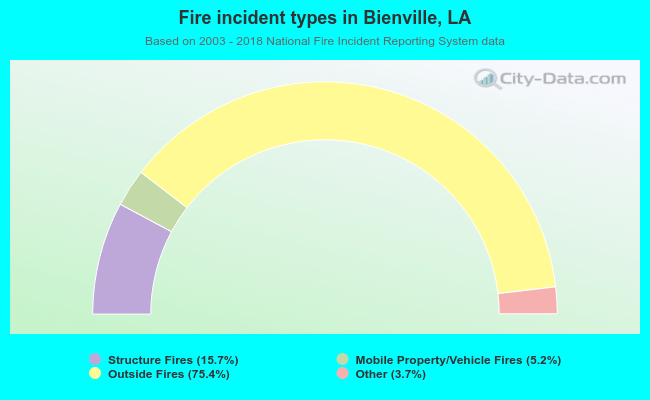 When looking into fire subcategories, the most reports belonged to: Outside Fires (75.4%), and Structure Fires (15.7%).