| Fire incidents reported |
|---|
| Sreet name | Count |
|---|
| PIONEER RD | 24 | | CINDER RD | 22 | | HOMESTEAD RD | 14 | | MARSHALL RD | 12 | | AYLSWORTH RD | 10 | | BROWNELL RD | 10 | | 669-THOMPSONVILLE HWY | 6 | | HAZE RD | 6 | | PINE TREE LN | 6 | | 185 BENZIE BLVD. | 4 | | 1851 EDEN HILL RD | 4 | | HONOR HWY | 4 | | INDIAN HILL RD | 4 | | US 31 HONOR HWY ST | 4 | | WELDON RD | 4 | | WORDEN RD | 4 | | ZIMMERMAN RD | 4 | | 1082 EDEN HILL | 2 | | 115 U S 31 | 2 | | 12688 CINDER RD | 2 | | 13345 HOMESTEAD RD | 2 | | 13917 BROWNELL RD. | 2 | | 1400 BEULAH HWY | 2 | | 1420 EDEN HILL RD | 2 | | 143 S BENZIE BLVD | 2 |
| | | Fire incidents reported |
|---|
| Sreet name | Count |
|---|
| 1438 THOMPSONVILLE HWY. | 2 | | 1589 MOSS RD. | 2 | | 1722 NICHOLS RD. | 2 | | 180.5 BENZIE ST. | 2 | | 19 S. PIONEER | 2 | | 1956 EDEN HILL RD | 2 | | 2177 COVEY RD. | 2 | | 2177 MOSS RD. | 2 | | 221 N. CENTER ST. | 2 | | 2215 MOSS RD | 2 | | 2507 WARREN RD | 2 | | 252 N. MICH. AVE. | 2 | | 254 N. MICH. AVE. | 2 | | 274 N PINE TREE LANE | 2 | | 3072 WARREN RD. | 2 | | 3600 WARREN RD. | 2 | | 390 S MARSHALL | 2 | | 400 COYRT PLACE | 2 | | 46N PIONEER RD. | 2 | | 498 ELDRIDGE RD | 2 | | 5313 CRYSTAL DR. | 2 | | 5412 CRYSTAL DR. | 2 | | 5510 CRYSTAL DR. | 2 | | 5752 CRYSTAL DR. | 2 | | 596 ZIMMERMAN | 2 |
|
 Based on the data from the years 2002 - 2018 the average number of fires per year is 10. The highest number of fire incidents - 21 took place in 2012, and the least - 2 in 2004. The data has a constant trend.
 31.4% incidents where reported in the morning and 68.6% in the evening. The most fires (18.3%) took place on Sunday, and the least (10.7%) on Thursday.
 According to the 169 incident reports from years 2002 - 2018 most fires (16.6%) took place during April, and the least (2.4%) in September.
 Out of all 801 cases reported during the years 2002 - 2018, the most belonged to the categories: Rescue & EMS (40.1%), Hazardous Condition (29.8%), and Fire (21.1%).
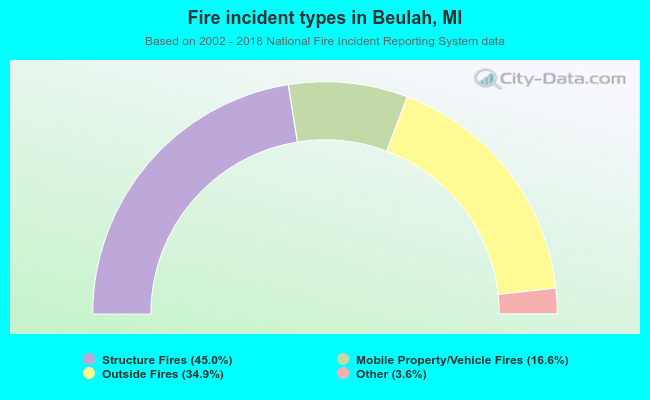 When looking into fire subcategories, the most incidents belonged to: Structure Fires (45.0%), and Outside Fires (34.9%).