| Fire incidents reported |
|---|
| Sreet name | Count |
|---|
| 31E HWY | 26 | | ROGUES FORK RD | 24 | | BUTLER MILL HOLLOW ROAD | 16 | | BROWNING BRANCH RD | 14 | | 231 HWY | 12 | | BASS RD | 12 | | HAWKINS BRANCH RD | 12 | | HWY 231 NORTH | 12 | | MT VERNON RD | 12 | | ROCK BRIDGE RD | 12 | | ALEXANDER LANE | 10 | | CHIPMAN RD | 10 | | ROCK BRIDGE RD | 10 | | TEMPLOW RD | 10 | | GRAVEL HILL RD | 8 | | HOG BACK RIDGE RD | 8 | | HWY 31 E | 8 | | HWY 52E | 8 | | ROCK SPRINGS RD | 8 | | 52 HWY | 6 | | BLACKY BANDY ROAD | 6 | | HIGHWAY 52 EAST | 6 | | HWY 31E HWY | 6 | | MOUNT VERNON ROAD | 6 | | MT. VERNON RD | 6 |
| | | Fire incidents reported |
|---|
| Sreet name | Count |
|---|
| MUTTON HOLLOW HILL RD | 6 | | OAK GROVE CHURCH RD | 6 | | OLD 31E RD | 6 | | ROCK BRIDGE ROAD | 6 | | ROCK HOUSE HOLLOW RD | 6 | | WOMACK RD | 6 | | BLACKEY BANDY RD | 4 | | BLACKEY BANDY RD | 4 | | BLACKEY BANDY ROAD | 4 | | BUCK PERRY RD | 4 | | CAL DURHAM RD | 4 | | CAL DURHAM ROAD | 4 | | DEWEY CARR RD | 4 | | FAIRFIELD RD | 4 | | FAIRFIELD RD | 4 | | GRIFF HOLLOW LN | 4 | | HARSH LN | 4 | | HARVE BROWN RD | 4 | | HARVE BROWN ROAD | 4 | | HIGHWAY 52E | 4 | | HOGBACK RIDGE RD | 4 | | HOMER SCOTT RD | 4 | | HWY 231 | 4 | | JAMES WHITEFIELD RD | 4 | | LAUDERDALE LN | 4 |
|
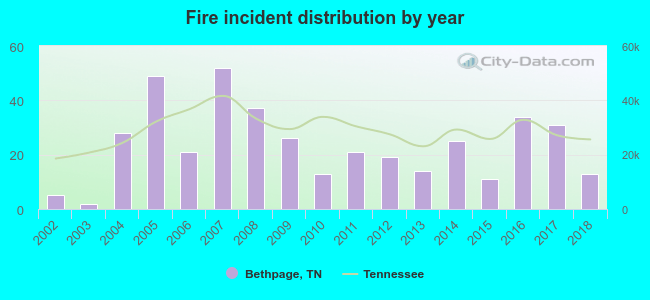 According to the data from the years 2002 - 2018 the average number of fire incidents per year is 24. The highest number of fires - 52 took place in 2007, and the least - 2 in 2003. The data has a rising trend.
 24.7% incidents where reported in the morning and 75.3% in the evening. The most fires (16.7%) took place on Saturday, and the least (11.2%) on Thursday.
 According to the 401 fire incidents from years 2002 - 2018 most fires (14.5%) took place during February, and the least (3.2%) in July.
 Out of all 1,086 cases reported during the years 2002 - 2018, the most belonged to the categories: Overpressure Rupture (45.5%), Fire (36.9%), and Service Call (10.0%).
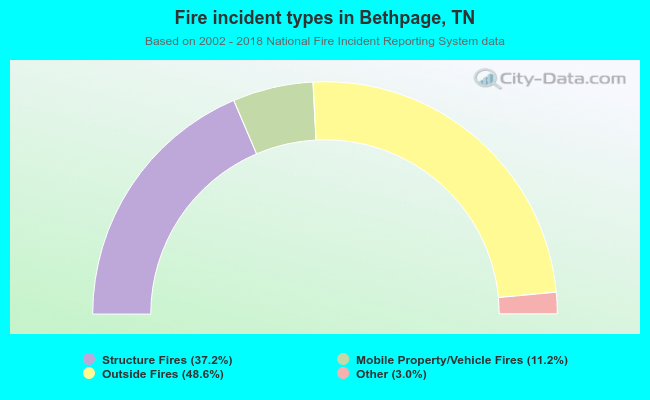 When looking into fire subcategories, the most incidents belonged to: Outside Fires (48.6%), and Structure Fires (37.2%).