| Fire incidents reported |
|---|
| Sreet name | Count |
|---|
| MAIN ST | 44 | | BILL MOORE RD | 24 | | GARRETT RD | 24 | | VIRGINIA ST | 20 | | BARNESVILLE-BETHESDA RD | 16 | | PEAR ST | 16 | | SPRING ST | 12 | | 26 RD | 10 | | PATTERSON MCENDREE RD | 10 | | SPEIDEL ST | 10 | | BROWN RD | 8 | | MAPLE AVE | 8 | | PERKINS RIDGE RD | 8 | | ROGERS RD | 8 | | RUSSELL LONG RUN RD | 8 | | BADGERSBURG RD | 6 | | BELMONT RD | 6 | | BETHESDA-BELMONT RD | 6 | | HELEN GREGG RD | 6 | | HUNTER-BETHESDA RD | 6 | | LAKE ST | 6 | | MCKINLEY AVE | 6 | | MCMILLAN RD | 6 | | MOORE-TURNER RD | 6 | | NATIONAL RD | 6 |
| | | Fire incidents reported |
|---|
| Sreet name | Count |
|---|
| NOON RD | 6 | | OAK ST | 6 | | PLEASANT RIDGE RD | 6 | | RICE AVE | 6 | | SECOND ST | 6 | | 1ST ST | 4 | | BARNESVILLE BETHESDA RD | 4 | | BARNESVILLEBETHESDA RD | 4 | | BELMONT-BETHESDA RD | 4 | | BOARDMAN ST | 4 | | CHURCH ST | 4 | | DEPOT ST | 4 | | DORY MILL RD | 4 | | GAIL AVE | 4 | | GARRITT RD | 4 | | GRACE ST | 4 | | HARRIS RD | 4 | | HUNTERBETHESDA RD | 4 | | INTERSTATE 70 HWY | 4 | | JOHNSON RD | 4 | | JUDSON ST | 4 | | LONG RUN RD | 4 | | MOORE TURNER RD | 4 | | PATTERSON-MCENDREE RD | 4 | | |
|
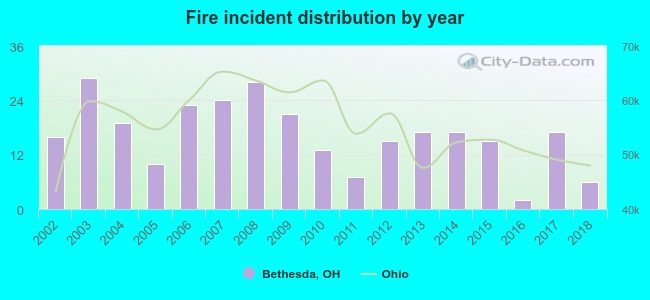 According to the data from the years 2002 - 2018 the average number of fires per year is 16. The highest number of reported fire incidents - 29 took place in 2003, and the least - 2 in 2016. The data has a declining trend.
 28.0% incidents where reported in the morning and 72.0% in the evening. The most fires (19.0%) took place on Sunday, and the least (9.0%) on Thursday.
 According to the 279 fires from years 2002 - 2018 most fires (16.8%) took place during March, and the least (5.0%) in May.
 Out of all 907 cases reported during the years 2002 - 2018, the most belonged to the categories: Rescue & EMS (49.2%), Fire (30.8%), and Hazardous Condition (11.7%).
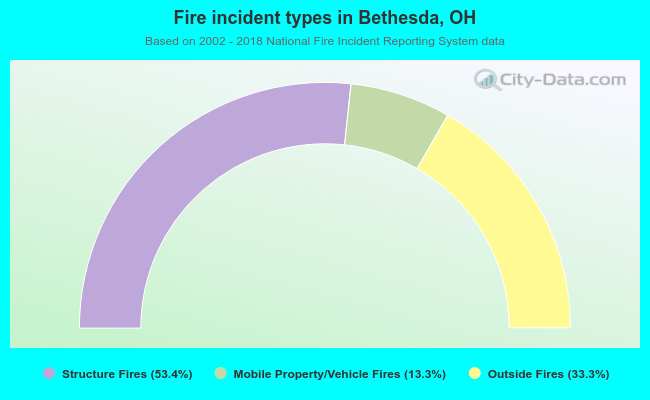 When looking into fire subcategories, the most incidents belonged to: Structure Fires (53.4%), and Outside Fires (33.3%).