Berlin: Fire Incidents, New Hampshire (NH)
Where are fire incidents reported in Berlin, NH
Something went wrong! Please refresh the page.
|
| |||||||||||||||||||||||||||||||||||||||||||||||||||||||||||||||||||||||||||||||||||||||||||||||||||||||||||||
2004 - 2018 National Fire Incident Reporting System (NFIRS) incidents
- Incident types reported to NFIRS in Berlin, NH
- 1,52735.3%Hazardous Condition
- 88220.4%Service Call
- 74917.3%Rescue & EMS
- 47210.9%False Alarm
- 44110.2%Fire
- 1794.1%Good Intent Call
- 350.8%Special Incident
- 270.6%Severe Weather
- 80.2%Overpressure Rupture
- Fire incident types reported to NFIRS in Berlin, NH
- 20947.4%Structure Fires
- 14733.3%Outside Fires
- 4510.2%Other
- 409.1%Mobile Property/Vehicle Fires
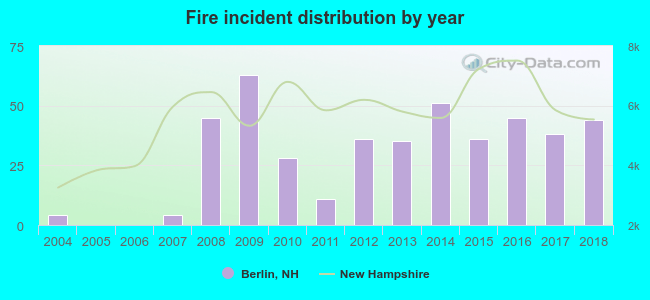 According to the data from the years 2004 - 2018 the average number of fire incidents per year is 29. The highest number of fire incidents - 63 took place in 2009, and the least - 0 in 2005. The data has a rising trend.
The average number of yearly fire incidents per 10k residents in Berlin, NH compared to nearest cities:
(Note: Based on data for the last 3 years, including only cities with population 5,000 and above)
| Berlin: | 44.6 |
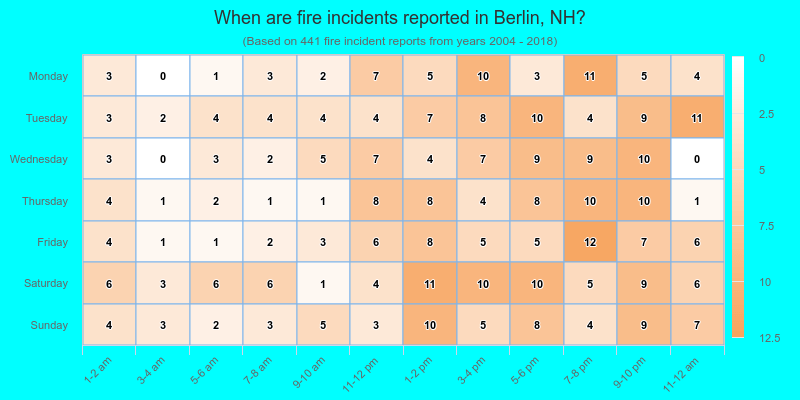
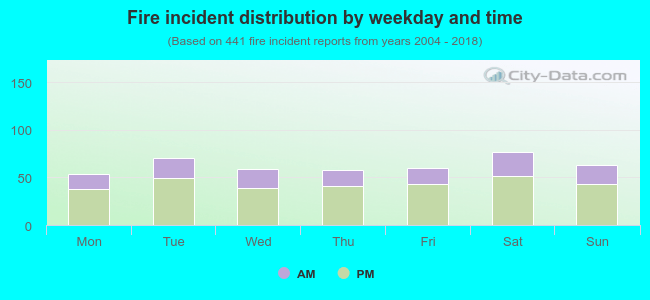 31.1% incidents where reported in the morning and 68.9% in the evening. The most fires (17.5%) took place on Saturday, and the least (12.2%) on Monday.
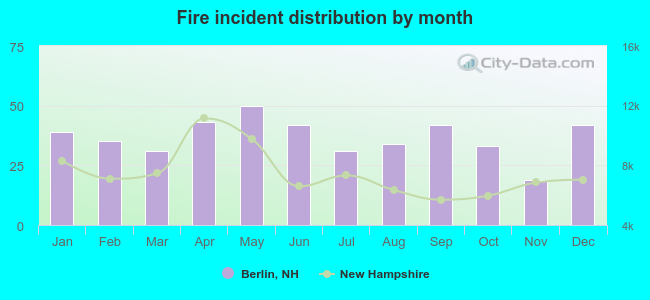 Based on the 441 fire incidents from years 2004 - 2018 most fires (11.3%) took place during May, and the least (4.3%) in November.
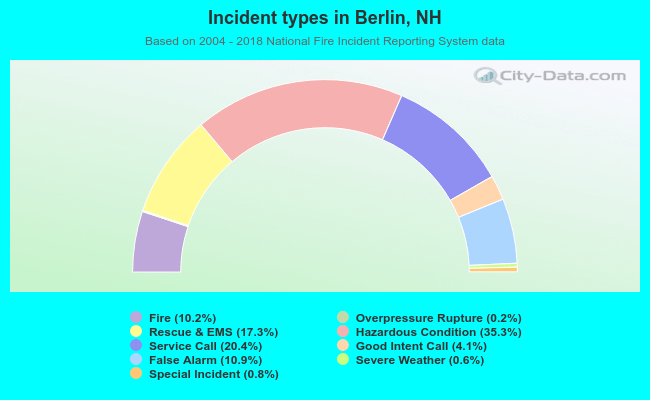 Out of all 4,320 cases reported during the years 2004 - 2018, the most belonged to the categories: Hazardous Condition (35.3%), Service Call (20.4%), and Rescue & EMS (17.3%).
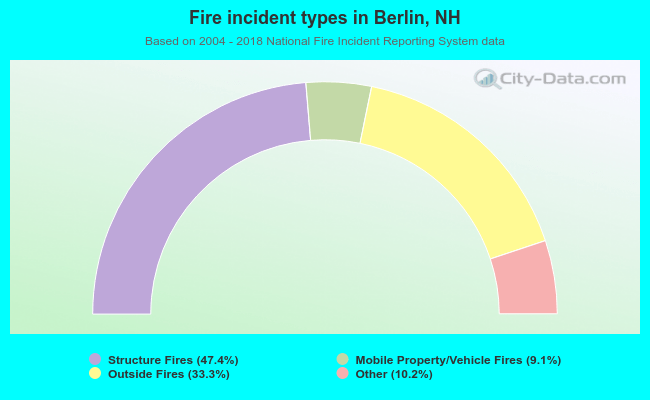 When looking into fire subcategories, the most reports belonged to: Structure Fires (47.4%), and Outside Fires (33.3%).