| Fire incidents reported |
|---|
| Sreet name | Count |
|---|
| BENZIE HWY | 10 | | HOMESTEAD RD | 6 | | 1345 HIGGINS RD. | 4 | | 7407 KING RD | 4 | | RIVER RD. | 4 | | SMELTZER RD | 4 | | TRAVERSE AVE | 4 | | 1089 BAILEY ST | 2 | | 1101 CASE RD | 2 | | 1101 CASE RD. | 2 | | 115 | 2 | | 1156 BARBER ST. | 2 | | 1523 HIGGINS RD. | 2 | | 1534 CASE RD | 2 | | 1747 BENZIE HWY | 2 | | 1749 HIGGINS RD. | 2 | | 1951 BENZIE HWY | 2 | | 1975 DAM RD. | 2 | | 1994 BENZIE HWY | 2 | | 2047 NORTHWOODS DR | 2 | | 2080 BENZIE HWY. | 2 | | 2311 CADILLAC HWY | 2 | | 2517 FOUR SEASONS RD | 2 | | 2592 WALLAKER RD. | 2 | | 2661 WALLAKER RD. | 2 |
| | | Fire incidents reported |
|---|
| Sreet name | Count |
|---|
| 2788 BENZIE HWY. | 2 | | 2788 U. S. 31 | 2 | | 2822 BENZIE HWY. | 2 | | 2868 HOADLEY RD | 2 | | 2983 BENZIE HWY | 2 | | 3100 BENZIE HWY | 2 | | 3160 BALLARD RD. | 2 | | 3581 WALLAKER | 2 | | 4319 RICE RD. | 2 | | 4373 CRAWFORD RD. | 2 | | 4538 BENZIE HWY. | 2 | | 4890 MICK RD. | 2 | | 5044 WALLAKER RD. | 2 | | 5075 GRACE RD | 2 | | 5498 KAST RD. | 2 | | 5528 MICK | 2 | | 5625 WALLAKER RD. | 2 | | 5840 WALLAKER RD. | 2 | | 6232 RIVER RD. | 2 | | 6293 RIVER RD. | 2 | | 6370 RIVER RD. | 2 | | 6392 RIVER RD | 2 | | 6511 MICK | 2 | | 6511 MICK RD. | 2 | | 6766 WALLAKER RD | 2 |
|
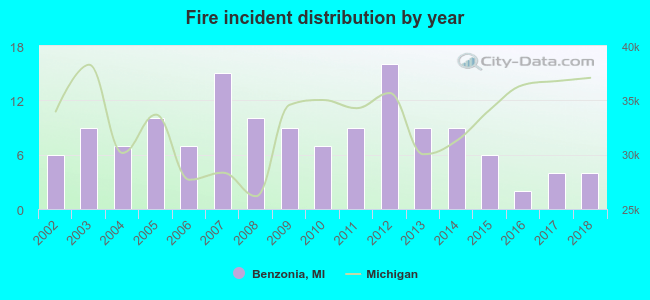 Based on the data from the years 2002 - 2018 the average number of fire incidents per year is 8. The highest number of reported fire incidents - 16 took place in 2012, and the least - 2 in 2016. The data has a decreasing trend.
 30.2% incidents where reported in the morning and 69.8% in the evening. The most fires (19.4%) took place on Tuesday, and the least (12.2%) on Thursday.
 According to the 139 fire incidents from years 2002 - 2018 most fires (16.5%) took place during July, and the least (2.9%) in November.
 Out of all 521 cases reported during the years 2002 - 2018, the most belonged to the categories: Hazardous Condition (60.3%), Fire (26.7%), and Good Intent Call (4.6%).
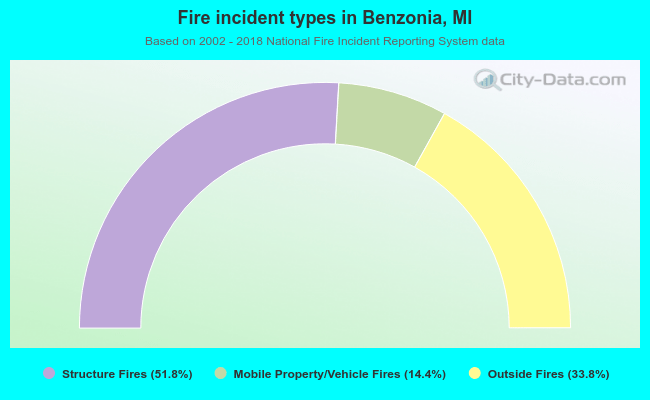 When looking into fire subcategories, the most incidents belonged to: Structure Fires (51.8%), and Outside Fires (33.8%).