Benton: Fire Incidents, Louisiana (LA)
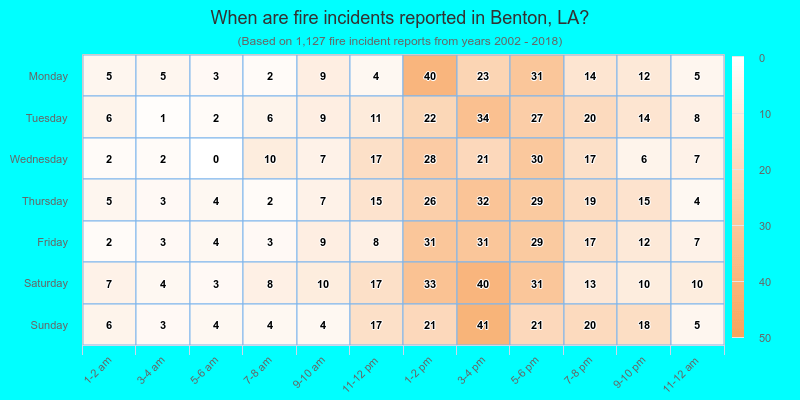
Where are fire incidents reported in Benton, LA
Something went wrong! Please refresh the page.
|
| |||||||||||||||||||||||||||||||||||||||||||||||||||||||||||||||||||||||||||||||||||||||||||||||||||||||||||||
2002 - 2018 National Fire Incident Reporting System (NFIRS) incidents
- Incident types reported to NFIRS in Benton, LA
- 4,31561.0%Rescue & EMS
- 1,12715.9%Fire
- 5517.8%Service Call
- 4856.9%Good Intent Call
- 3985.6%Hazardous Condition
- 1782.5%False Alarm
- 90.1%Severe Weather
- Fire incident types reported to NFIRS in Benton, LA
- 78669.7%Outside Fires
- 21819.3%Structure Fires
- 1008.9%Mobile Property/Vehicle Fires
- 232.0%Other
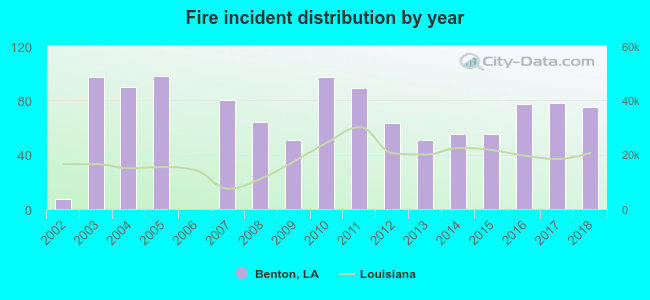 Based on the data from the years 2002 - 2018 the average number of fire incidents per year is 66. The highest number of reported fire incidents - 98 took place in 2005, and the least - 0 in 2006. The data has a rising trend.
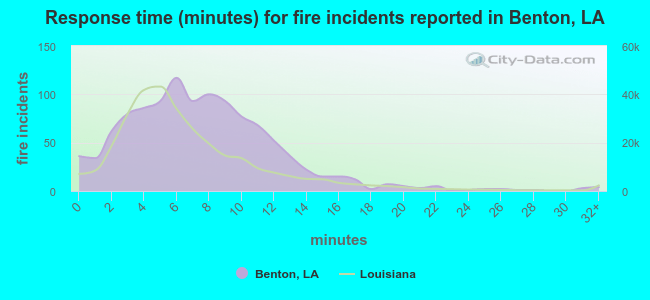 The median response time based on all reported fire incidents is 7 minutes. This is about the same as the Louisiana median value.
The median response time in Benton, LA compared to nearest cities:
(Note: Based on data for all years, including only cities with at least 500 fire incidents)
| Benton: | 7 minutes |
| Bossier City: | 4 minutes |
| Plain Dealing: | 9 minutes |
| Shreveport: | 5 minutes |
| Haughton: | 6 minutes |
| Vivian: | 6 minutes |
| Springhill: | 5 minutes |
| Minden: | 5 minutes |
| Ringgold: | 8 minutes |
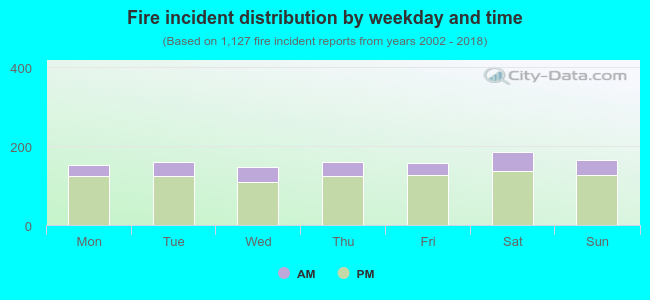 22.4% incidents where reported in the morning and 77.6% in the evening. The most fires (16.5%) took place on Saturday, and the least (13.0%) on Wednesday.
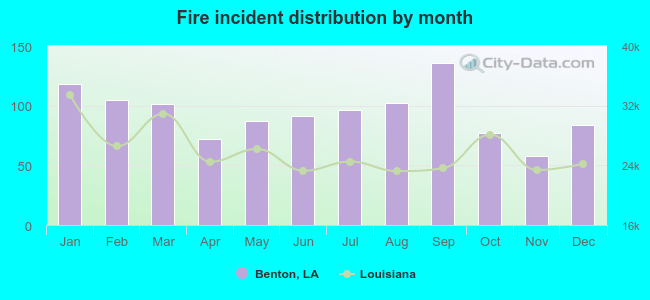 Based on the 1,127 fire incidents from years 2002 - 2018 most fires (12.1%) took place during September, and the least (5.1%) in November.
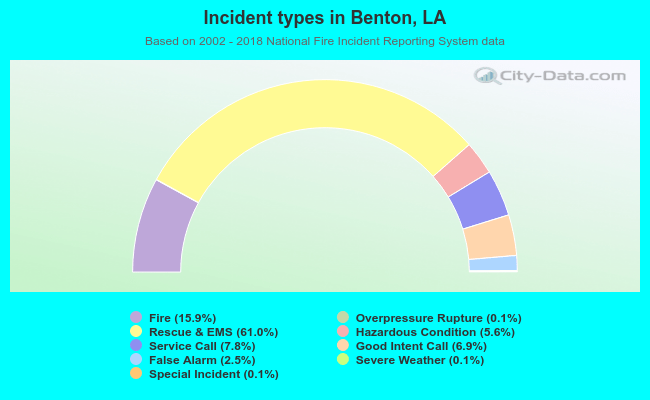 Out of all 7,074 cases reported during the years 2002 - 2018, the most belonged to the categories: Rescue & EMS (61.0%), Fire (15.9%), and Service Call (7.8%).
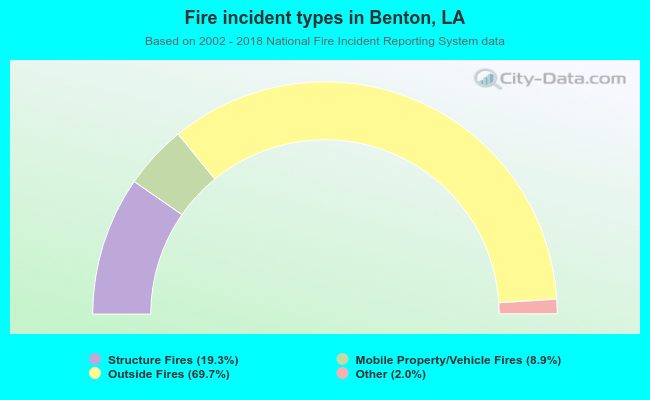 When looking into fire subcategories, the most reports belonged to: Outside Fires (69.7%), and Structure Fires (19.3%).