Bentleyville: Fire Incidents, Pennsylvania (PA)
Where are fire incidents reported in Bentleyville, PA
Something went wrong! Please refresh the page.
|
| |||||||||||||||||||||||||||||||||||||||||||||||||||||||||||||||||||||||||||||||||||||||||||||||||||||||||||||
2010 - 2018 National Fire Incident Reporting System (NFIRS) incidents
- Incident types reported to NFIRS in Bentleyville, PA
- 68462.2%Rescue & EMS
- 14212.9%Fire
- 867.8%Hazardous Condition
- 645.8%Service Call
- 514.6%False Alarm
- 363.3%Severe Weather
- 242.2%Good Intent Call
- 111.0%Special Incident
- Fire incident types reported to NFIRS in Bentleyville, PA
- 8257.7%Structure Fires
- 2618.3%Outside Fires
- 2215.5%Other
- 128.5%Mobile Property/Vehicle Fires
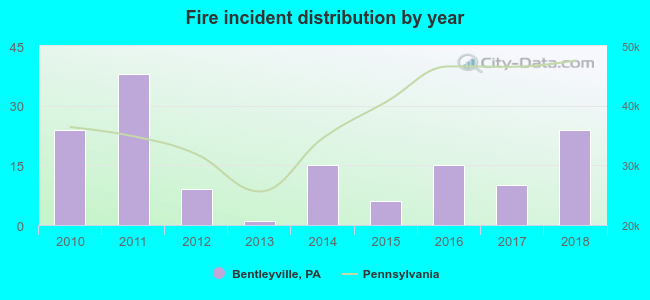 Based on the data from the years 2010 - 2018 the average number of fires per year is 16. The highest number of reported fire incidents - 38 took place in 2011, and the least - 1 in 2013. The data has a constant trend.
 31.0% incidents where reported in the morning and 69.0% in the evening. The most fires (23.9%) took place on Thursday, and the least (9.2%) on Monday.
 Based on the 142 fire incidents from years 2010 - 2018 most fires (16.2%) took place during September, and the least (1.4%) in June.
 Out of all 1,099 cases reported during the years 2010 - 2018, the most belonged to the categories: Rescue & EMS (62.2%), Fire (12.9%), and Hazardous Condition (7.8%).
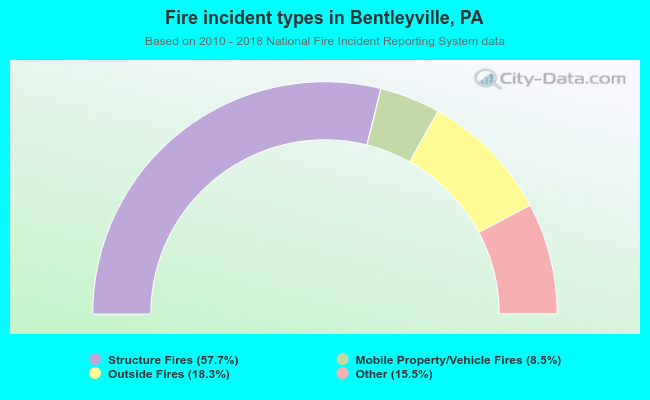 When looking into fire subcategories, the most incidents belonged to: Structure Fires (57.7%), and Outside Fires (18.3%).