| Fire incidents reported |
|---|
| Sreet name | Count |
|---|
| COUNTY HIGHWAY A | 12 | | EXETER CROSSING RD | 12 | | FRITZ RD | 10 | | HWY D | 10 | | MONTROSE ROAD | 10 | | WALTER RD | 10 | | WEST MAIN STREET | 10 | | COUNTY HIGHWAY CC | 8 | | FOURTH ST | 8 | | GEHIN RD | 8 | | NORTH SHORE DRIVE | 8 | | BOWLAVARD AVE | 6 | | CHRISTEN RD | 6 | | COUNTY HWY D | 6 | | COUNTY HWY PB | 6 | | CTY HWY D | 6 | | ENTERPRISE DR | 6 | | EXETER CROSSING | 6 | | EXETER CROSSING RD | 6 | | FRITZ ROAD | 6 | | HUGHES RD | 6 | | HWY 69 | 6 | | MAIN ST | 6 | | MONTROSE ROAD | 6 | | NORTH SHORE DR | 6 |
| | | Fire incidents reported |
|---|
| Sreet name | Count |
|---|
| PINE VALLEY RD | 6 | | RIVER ST | 6 | | VISTA LN | 6 | | 1347 DIANE AVENUE, PAOLI | 4 | | 6397 COUNTY HWY A | 4 | | ARGUE ROAD | 4 | | CNTY CC | 4 | | COUNTRYSIDE DR | 4 | | COUNTRYSIDE DR | 4 | | COUNTY HIGHWAY CC HWY | 4 | | COUNTY HIGHWAY PB | 4 | | COUNTY HIGHWAY PB HWY | 4 | | COUNTY HWY A | 4 | | COUNTY X HWY | 4 | | CTH CC | 4 | | DIANNE AVE | 4 | | EAST CHURCH STREET | 4 | | GEHIN RD | 4 | | HWY CC | 4 | | HWY W | 4 | | MADISON STREET | 4 | | MILWAUKEE ST | 4 | | PERNOT LANE | 4 | | PILLER ROAD | 4 | | PURCELL RD | 4 |
|
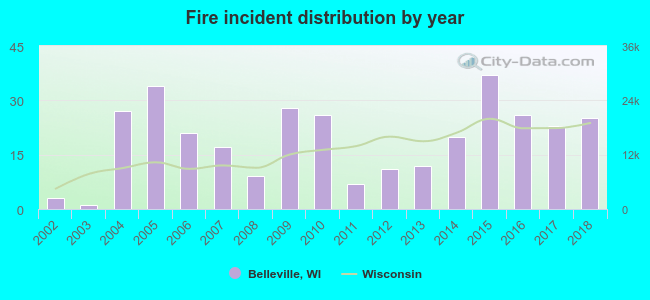 Based on the data from the years 2002 - 2018 the average number of fires per year is 19. The highest number of reported fire incidents - 37 took place in 2015, and the least - 1 in 2003. The data has a rising trend.
 27.2% incidents where reported in the morning and 72.8% in the evening. The most fires (16.8%) took place on Friday, and the least (9.5%) on Monday.
 According to the 327 fire incident reports from years 2002 - 2018 most fires (20.5%) took place during April, and the least (3.4%) in June.
 Out of all 885 cases reported during the years 2002 - 2018, the most belonged to the categories: Fire (36.9%), Rescue & EMS (26.9%), and Good Intent Call (13.2%).
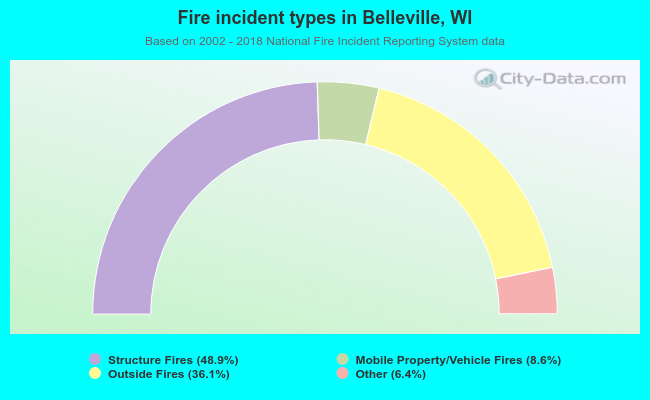 When looking into fire subcategories, the most reports belonged to: Structure Fires (48.9%), and Outside Fires (36.1%).