Bell: Fire Incidents, Florida (FL)
Where are fire incidents reported in Bell, FL
Something went wrong! Please refresh the page.
|
| |||||||||||||||||||||||||||||||||||||||||||||||||||||||||||||||||||||||||||||||||||||||||||||||||||||||||||||
| Other | 57 | |||||||||||||||||||||||||||||||||||||||||||||||||||||||||||||||||||||||||||||||||||||||||||||||||||||||||||||
2002 - 2018 National Fire Incident Reporting System (NFIRS) incidents
- Incident types reported to NFIRS in Bell, FL
- 48241.6%Rescue & EMS
- 35330.5%Fire
- 15813.6%Good Intent Call
- 13211.4%Hazardous Condition
- 221.9%Service Call
- 110.9%False Alarm
- Fire incident types reported to NFIRS in Bell, FL
- 19555.2%Outside Fires
- 9727.5%Structure Fires
- 4713.3%Mobile Property/Vehicle Fires
- 144.0%Other
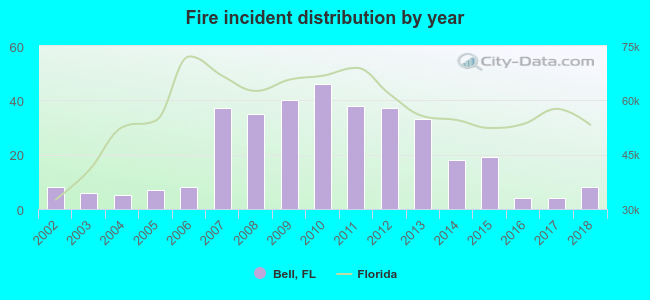 According to the data from the years 2002 - 2018 the average number of fires per year is 21. The highest number of fire incidents - 46 took place in 2010, and the least - 4 in 2016. The data has a constant trend.
 24.6% incidents where reported in the morning and 75.4% in the evening. The most fires (17.0%) took place on Thursday, and the least (12.5%) on Sunday.
 Based on the 353 fire incident reports from years 2002 - 2018 most fires (15.0%) took place during May, and the least (4.0%) in November.
 Out of all 1,159 cases reported during the years 2002 - 2018, the most belonged to the categories: Overpressure Rupture (41.6%), Fire (30.5%), and Service Call (13.6%).
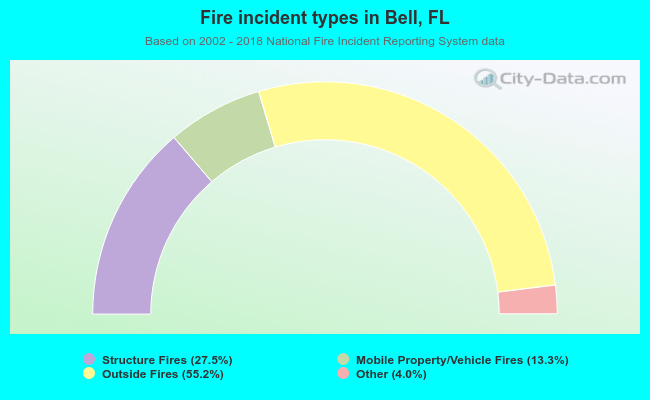 When looking into fire subcategories, the most reports belonged to: Outside Fires (55.2%), and Structure Fires (27.5%).