Belgium: Fire Incidents, Wisconsin (WI)
Where are fire incidents reported in Belgium, WI
Something went wrong! Please refresh the page.
|
| |||||||||||||||||||||||||||||||||||||||||||||||||||||||||||||||||||||||||||||||||||||||||||||||||||||||||||||
2002 - 2018 National Fire Incident Reporting System (NFIRS) incidents
- Incident types reported to NFIRS in Belgium, WI
- 59370.3%Rescue & EMS
- 14317.0%Fire
- 374.4%Good Intent Call
- 293.4%False Alarm
- 283.3%Hazardous Condition
- 91.1%Service Call
- 40.5%Severe Weather
- Fire incident types reported to NFIRS in Belgium, WI
- 7955.2%Structure Fires
- 3927.3%Outside Fires
- 1913.3%Mobile Property/Vehicle Fires
- 64.2%Other
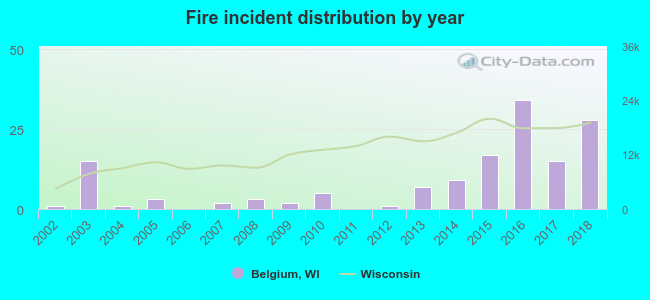 Based on the data from the years 2002 - 2018 the average number of fires per year is 8. The highest number of fires - 34 took place in 2016, and the least - 0 in 2006. The data has an increasing trend.
 28.7% incidents where reported in the morning and 71.3% in the evening. The most fires (22.4%) took place on Tuesday, and the least (6.3%) on Wednesday.
 Based on the 143 incident reports from years 2002 - 2018 most fires (16.1%) took place during December, and the least (2.8%) in September.
 Out of all 843 cases reported during the years 2002 - 2018, the most belonged to the categories: Overpressure Rupture (70.3%), Fire (17.0%), and Service Call (4.4%).
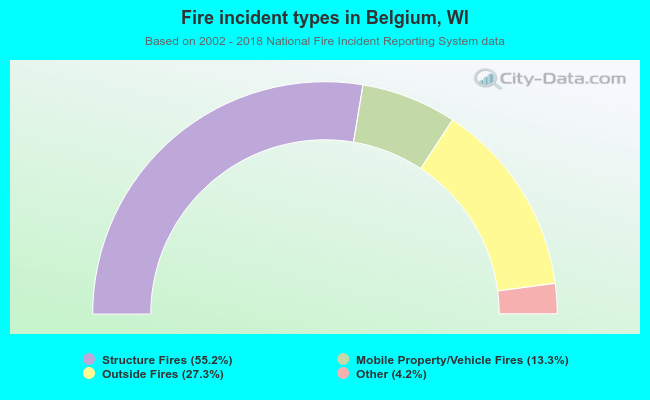 When looking into fire subcategories, the most incidents belonged to: Structure Fires (55.2%), and Outside Fires (27.3%).