| Fire incidents reported |
|---|
| Sreet name | Count |
|---|
| BOWER RD | 10 | | ST CHARLES | 10 | | STATE LINE RD | 10 | | 250 S BOWER RD | 8 | | 353 S. STATE LINE RD. | 6 | | DEER LN | 6 | | STATELINE RD | 6 | | 195 MALARD RD | 4 | | 218 S. BOWER RD. | 4 | | 226 DEER LANE | 4 | | 3000 N RD | 4 | | 313 S BOWER RD | 4 | | 313 SOUTH BOWER RD | 4 | | BOWER RD | 4 | | DEER LANE | 4 | | DONOVAN ST | 4 | | S. BOWER RD. | 4 | | ST CHARLES ST | 4 | | STATE LINE ROAD | 4 | | 100 PILKE RD | 2 | | 120 S BOWER RD | 2 | | 129 S. BAUER RD. | 2 | | 184 S. BOWER RD | 2 | | 184 SOUTH BOWER RD | 2 | | 207 ST CHARLES STREET | 2 |
| | | Fire incidents reported |
|---|
| Sreet name | Count |
|---|
| 213 N. STATE LINE RD | 2 | | 213 N. STATE LINE RD | 2 | | 218 S. BOWER ROAD | 2 | | 2407 EAST 2900 NORTH | 2 | | 2478 E. 3100 N. | 2 | | 2478 E. 3100 N. RD. | 2 | | 250 N. STATELINE ROAD | 2 | | 2532 E 3250 N | 2 | | 2532 E 3250 N RD | 2 | | 2532 E 3250N RD | 2 | | 2643 E 3000 N | 2 | | 2643 E 3000 N RD | 2 | | 2700 | 2 | | 2700 E 3200 N RD | 2 | | 2700 E. 3300 NORTH ROAD | 2 | | 2700 EAST RD | 2 | | 2700E 3200 N RD | 2 | | 2752 E. 3200 N. RD. | 2 | | 2800 E. 3100 N. RD. | 2 | | 2803 E 3300 N RD | 2 | | 2844 E 3000 N RD | 2 | | 2900 N | 2 | | 2900 N 2500 E | 2 | | 2950 | 2 | | |
|
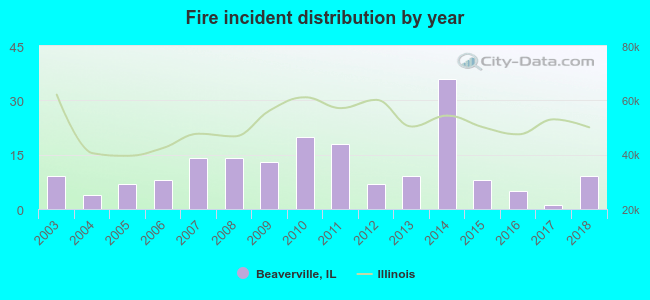 Based on the data from the years 2003 - 2018 the average number of fire incidents per year is 11. The highest number of reported fire incidents - 36 took place in 2014, and the least - 1 in 2017. The data has a constant trend.
 30.8% incidents where reported in the morning and 69.2% in the evening. The most fires (17.6%) took place on Monday, and the least (11.5%) on Wednesday.
 According to the 182 fire incidents from years 2003 - 2018 most fires (18.1%) took place during April, and the least (0.5%) in December.
 Out of all 225 cases reported during the years 2003 - 2018, the most belonged to the categories: Fire (80.9%), Service Call (6.7%), and Rescue & EMS (5.8%).
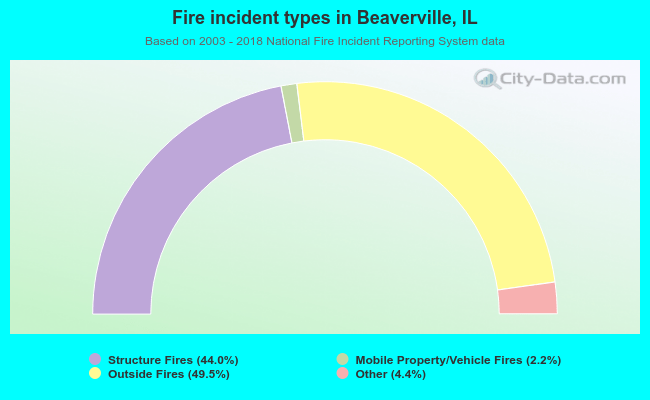 When looking into fire subcategories, the most incidents belonged to: Outside Fires (49.5%), and Structure Fires (44.0%).