Beaver: Fire Incidents, Pennsylvania (PA)
Where are fire incidents reported in Beaver, PA
Something went wrong! Please refresh the page.
|
| |||||||||||||||||||||||||||||||||||||||||||||||||||||||||||||||||||||||||||||||||||||||||||||||||||||||||||||
2004 - 2018 National Fire Incident Reporting System (NFIRS) incidents
- Incident types reported to NFIRS in Beaver, PA
- 34435.7%Fire
- 30331.5%Hazardous Condition
- 13113.6%False Alarm
- 778.0%Service Call
- 545.6%Good Intent Call
- 464.8%Rescue & EMS
- 70.7%Special Incident
- 10.1%Severe Weather
- Fire incident types reported to NFIRS in Beaver, PA
- 17350.3%Structure Fires
- 7923.0%Outside Fires
- 5415.7%Other
- 3811.0%Mobile Property/Vehicle Fires
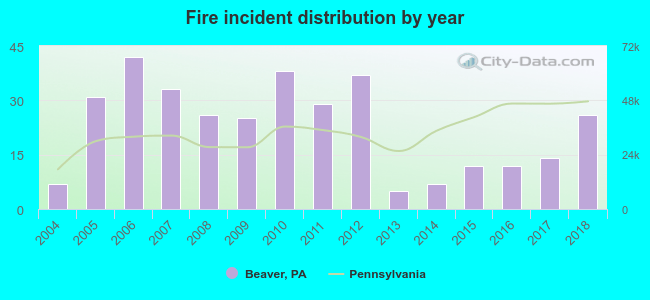 Based on the data from the years 2004 - 2018 the average number of fires per year is 23. The highest number of reported fires - 42 took place in 2006, and the least - 5 in 2013. The data has a rising trend.
 27.6% incidents where reported in the morning and 72.4% in the evening. The most fires (16.9%) took place on Saturday, and the least (11.3%) on Friday.
 Based on the 344 reports from years 2004 - 2018 most fires (13.1%) took place during March, and the least (4.4%) in February.
 Out of all 963 cases reported during the years 2004 - 2018, the most belonged to the categories: Fire (35.7%), Rescue & EMS (31.5%), and Good Intent Call (13.6%).
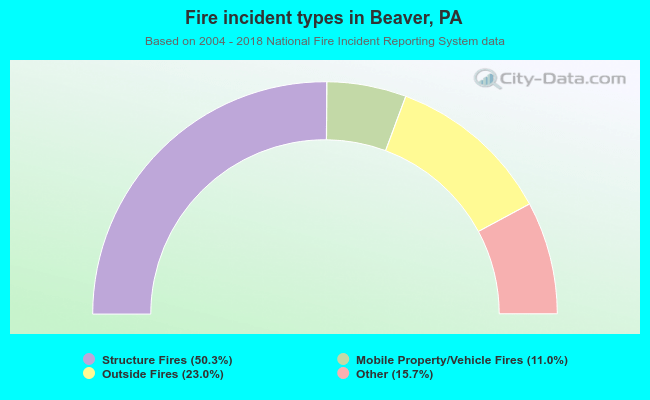 When looking into fire subcategories, the most incidents belonged to: Structure Fires (50.3%), and Outside Fires (23.0%).